Heading with four stats
Right next to heading and description here one can display four key stats
Simple stats page
Display four simple stats, data and numbers with heading below.
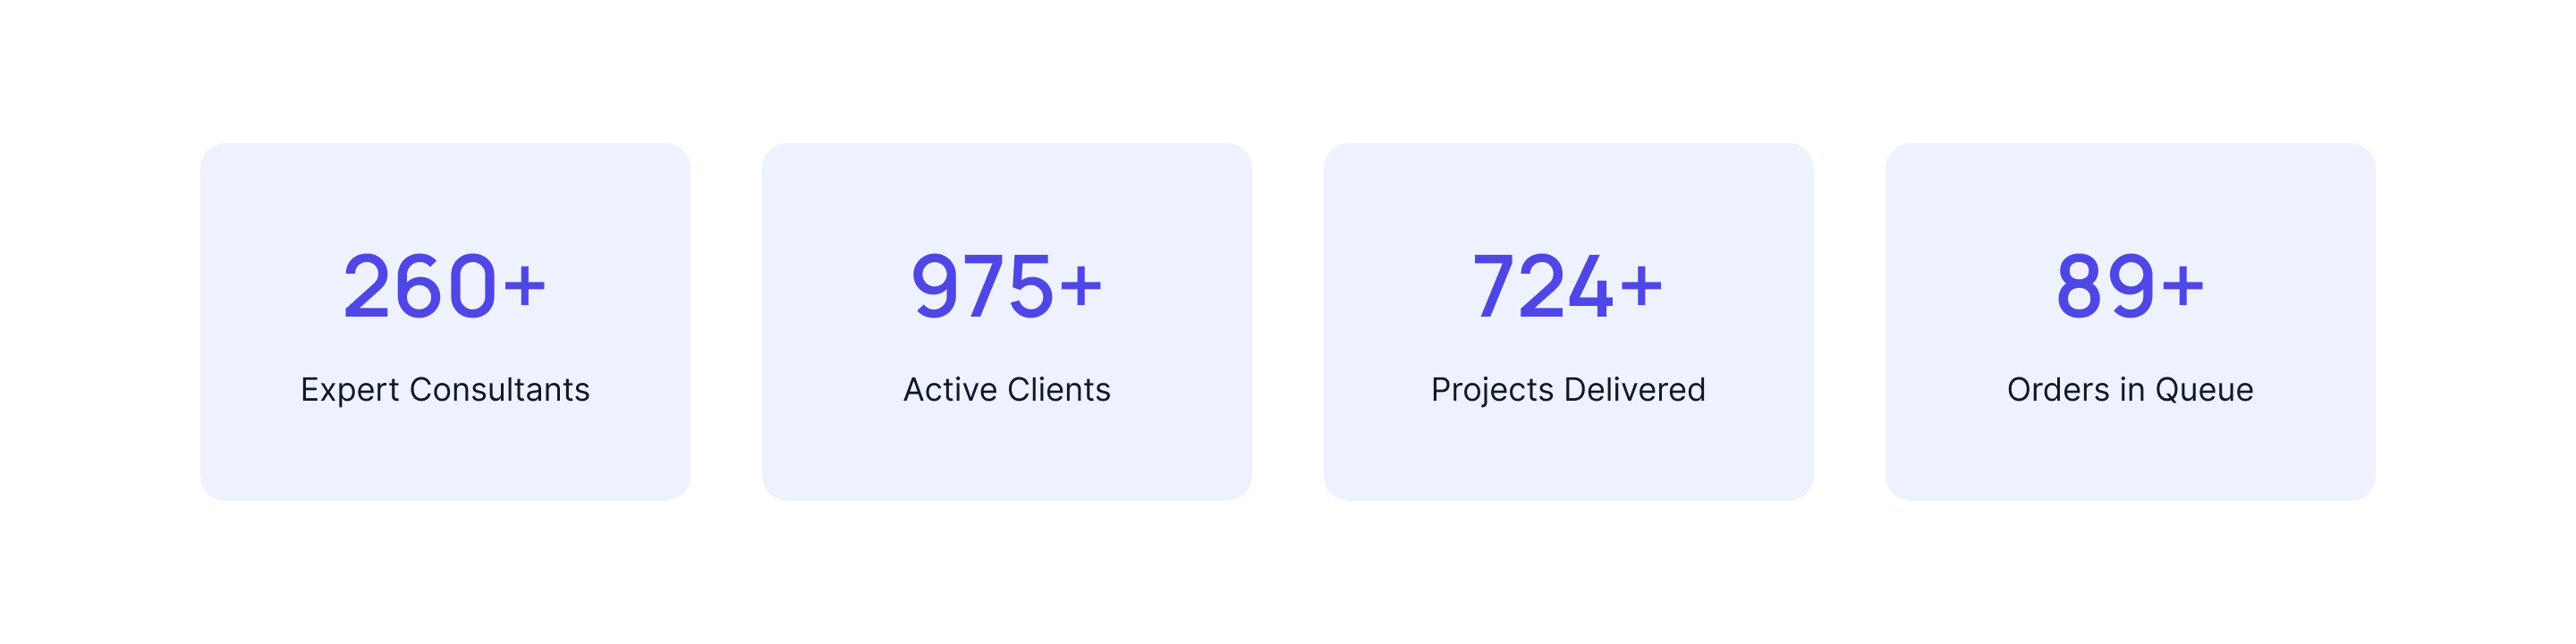
Stats with custom colour
Highlight stats with custom colours and mention description below each stat as shown in the following tailwind stats component.
Stats with indicators
Differentiate stats by showing different indicator alongside each of the stats.

Stats with border
It is pretty similar to the above style, the only difference will be instead of indicator here borders will be kept with different stats.
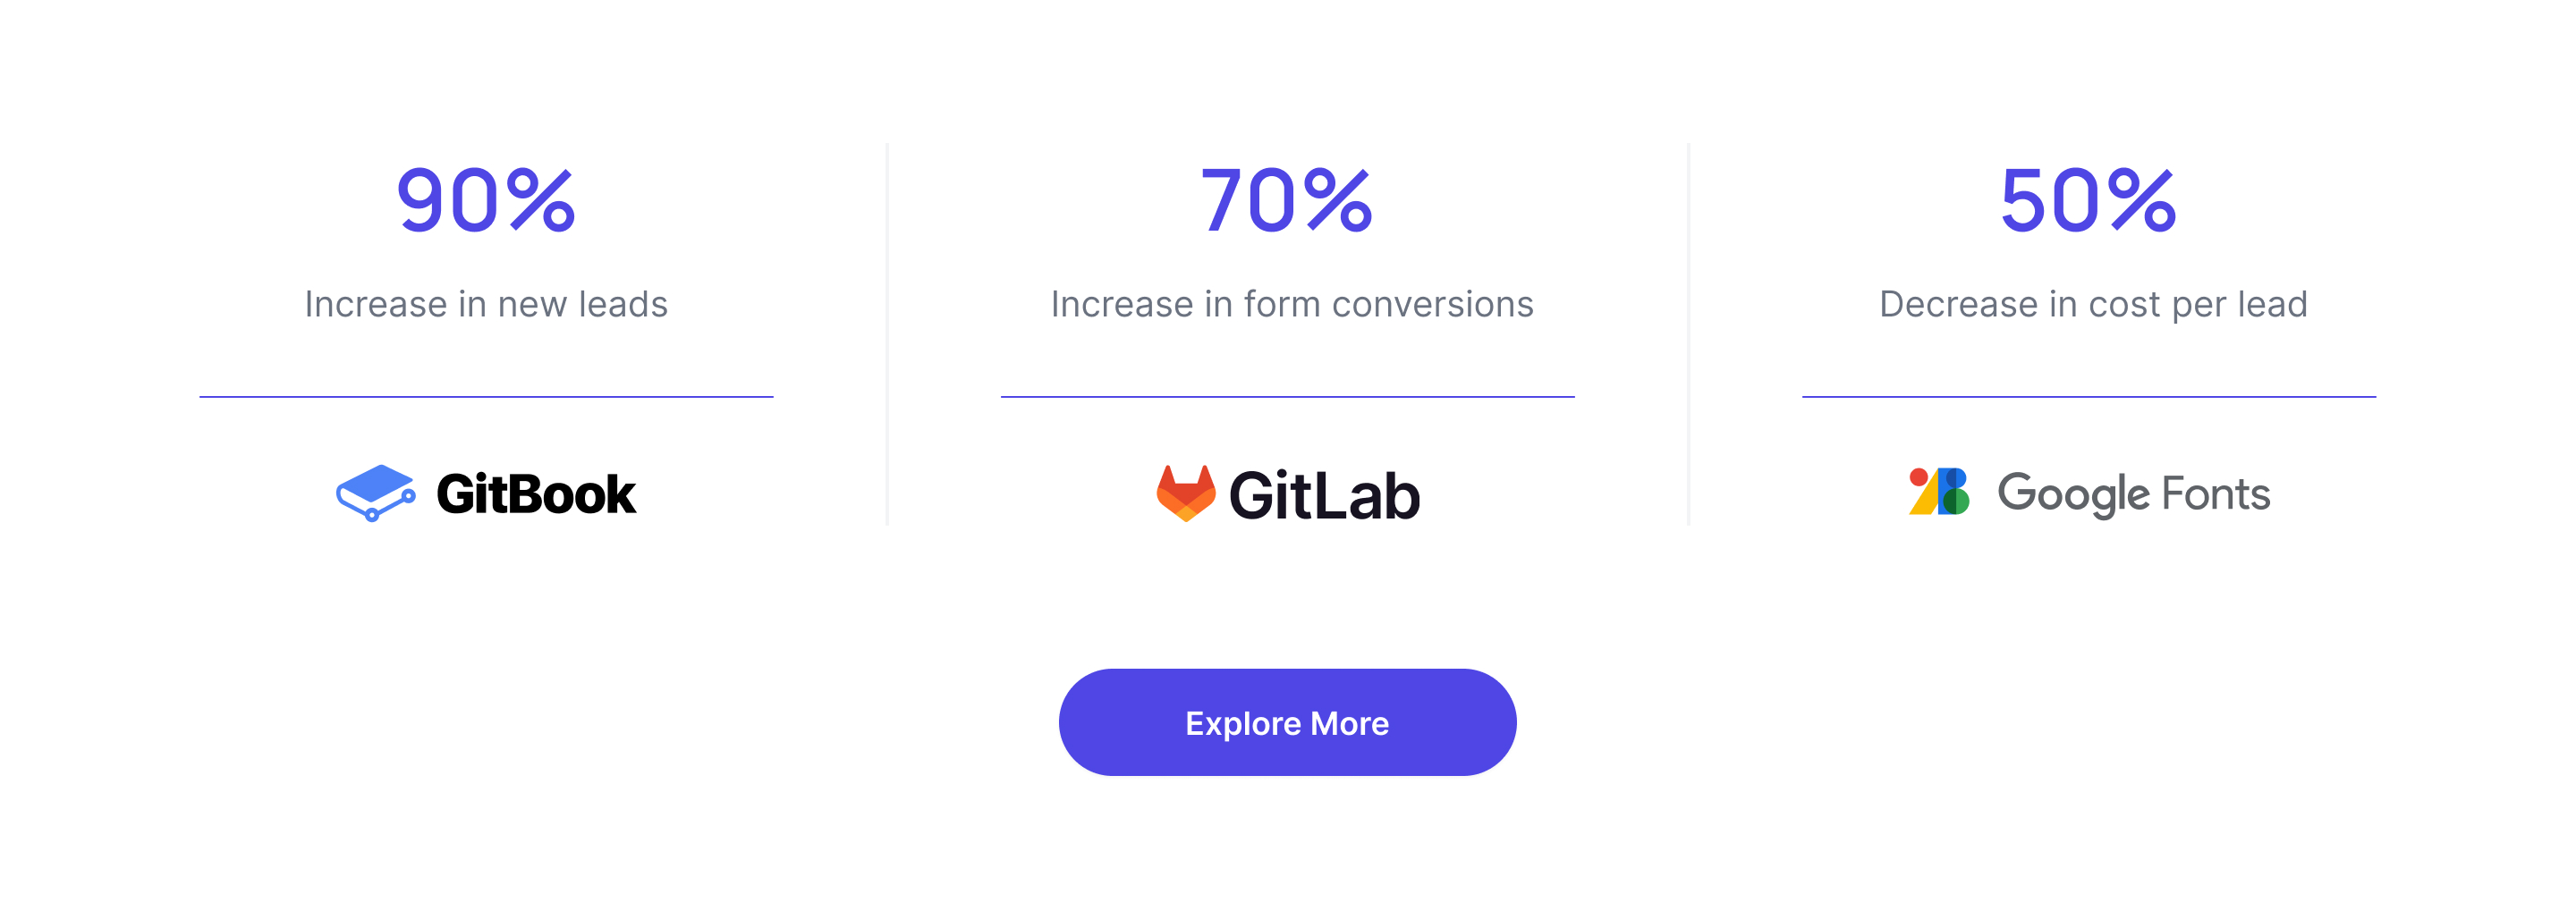
Stats with brand logos
With brand logos and border you can showcase different stats for different clients.
Stats with custom icon
Put different icons for different stats to make it easier for visitors to understand.
Tailwind Stats Card
Display stats in card layout with different icons and heading.
Stats with background
Here one can use background colour in card layout style and keep heading below each stat.
Stats with creative design
Show numbers in style, use card layout and use different colour as background. This makes the page look more attractive.
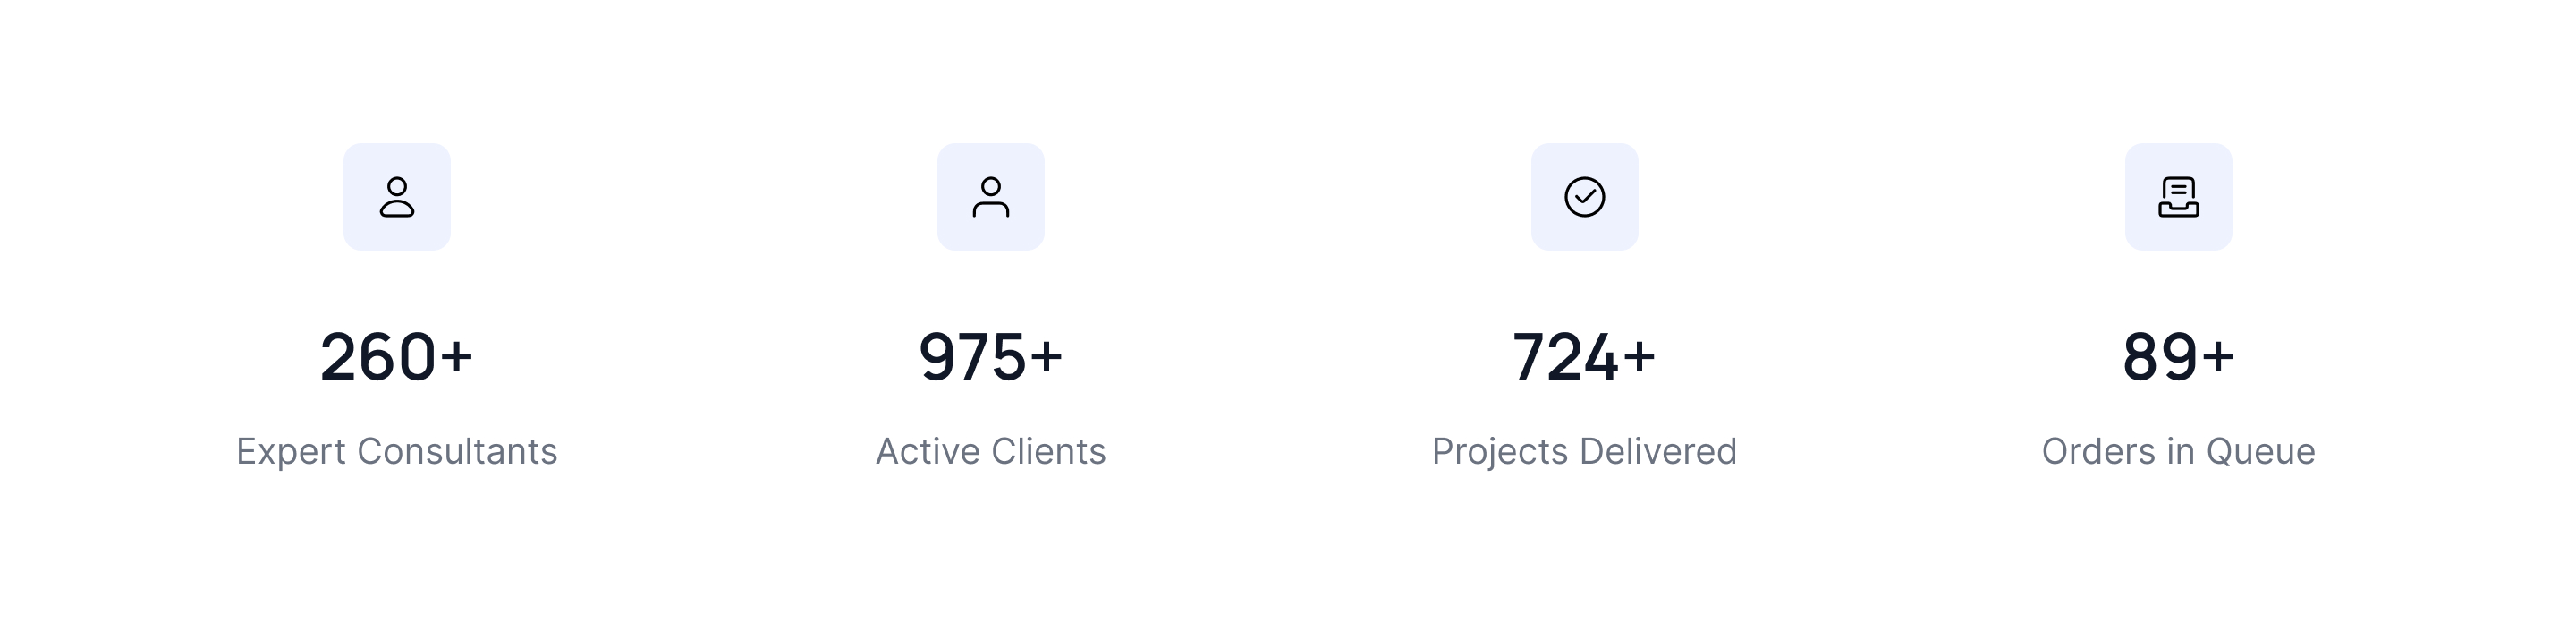
Horizontal stats
Show numbers and stats horizontally and keep icons next to each of the statistics.
Stats with horizontal description
Using the following Tailwind CSS Stats you can show stats, heading and description horizontally.
Stats with icon background
This tailwind css stats can be used to add background to custom icons of stats with heading.
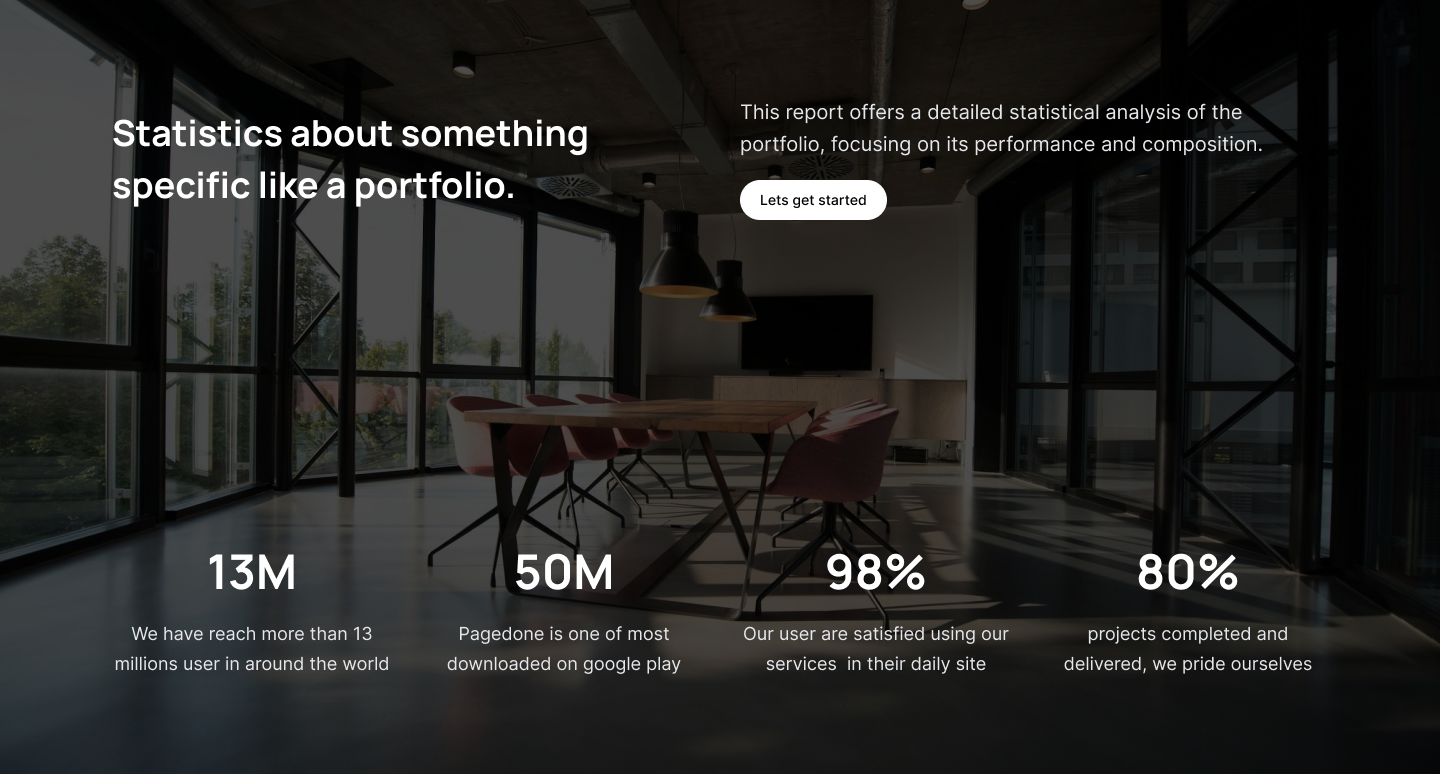
Split with heading
Mention heading and description with CTA buttons on the other half of the stats.
Vertical stats
This Tailwind Stats card Show stats vertically with numbers in bold, description and heading.
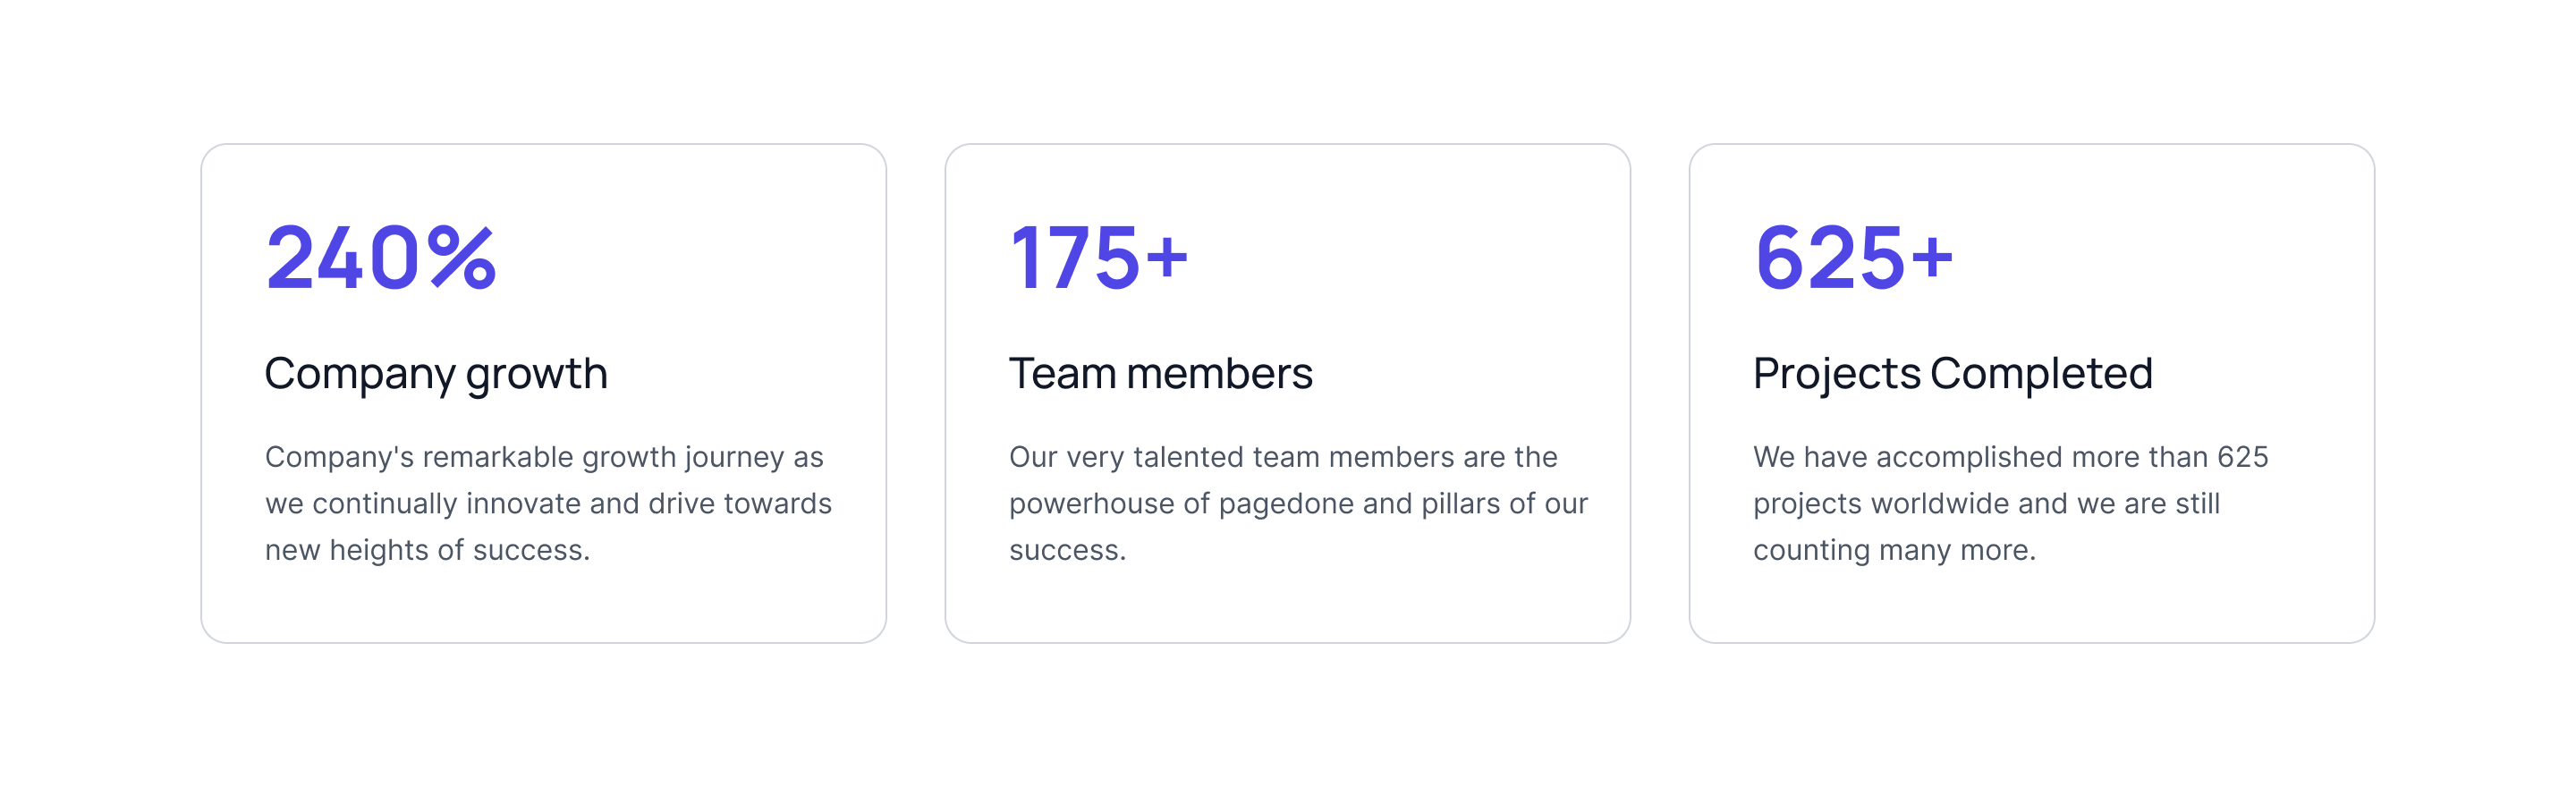
Heading with Four Stats
Showcase four key business metrics alongside bold headings and clear descriptions, making your achievements easily understandable for visitors.
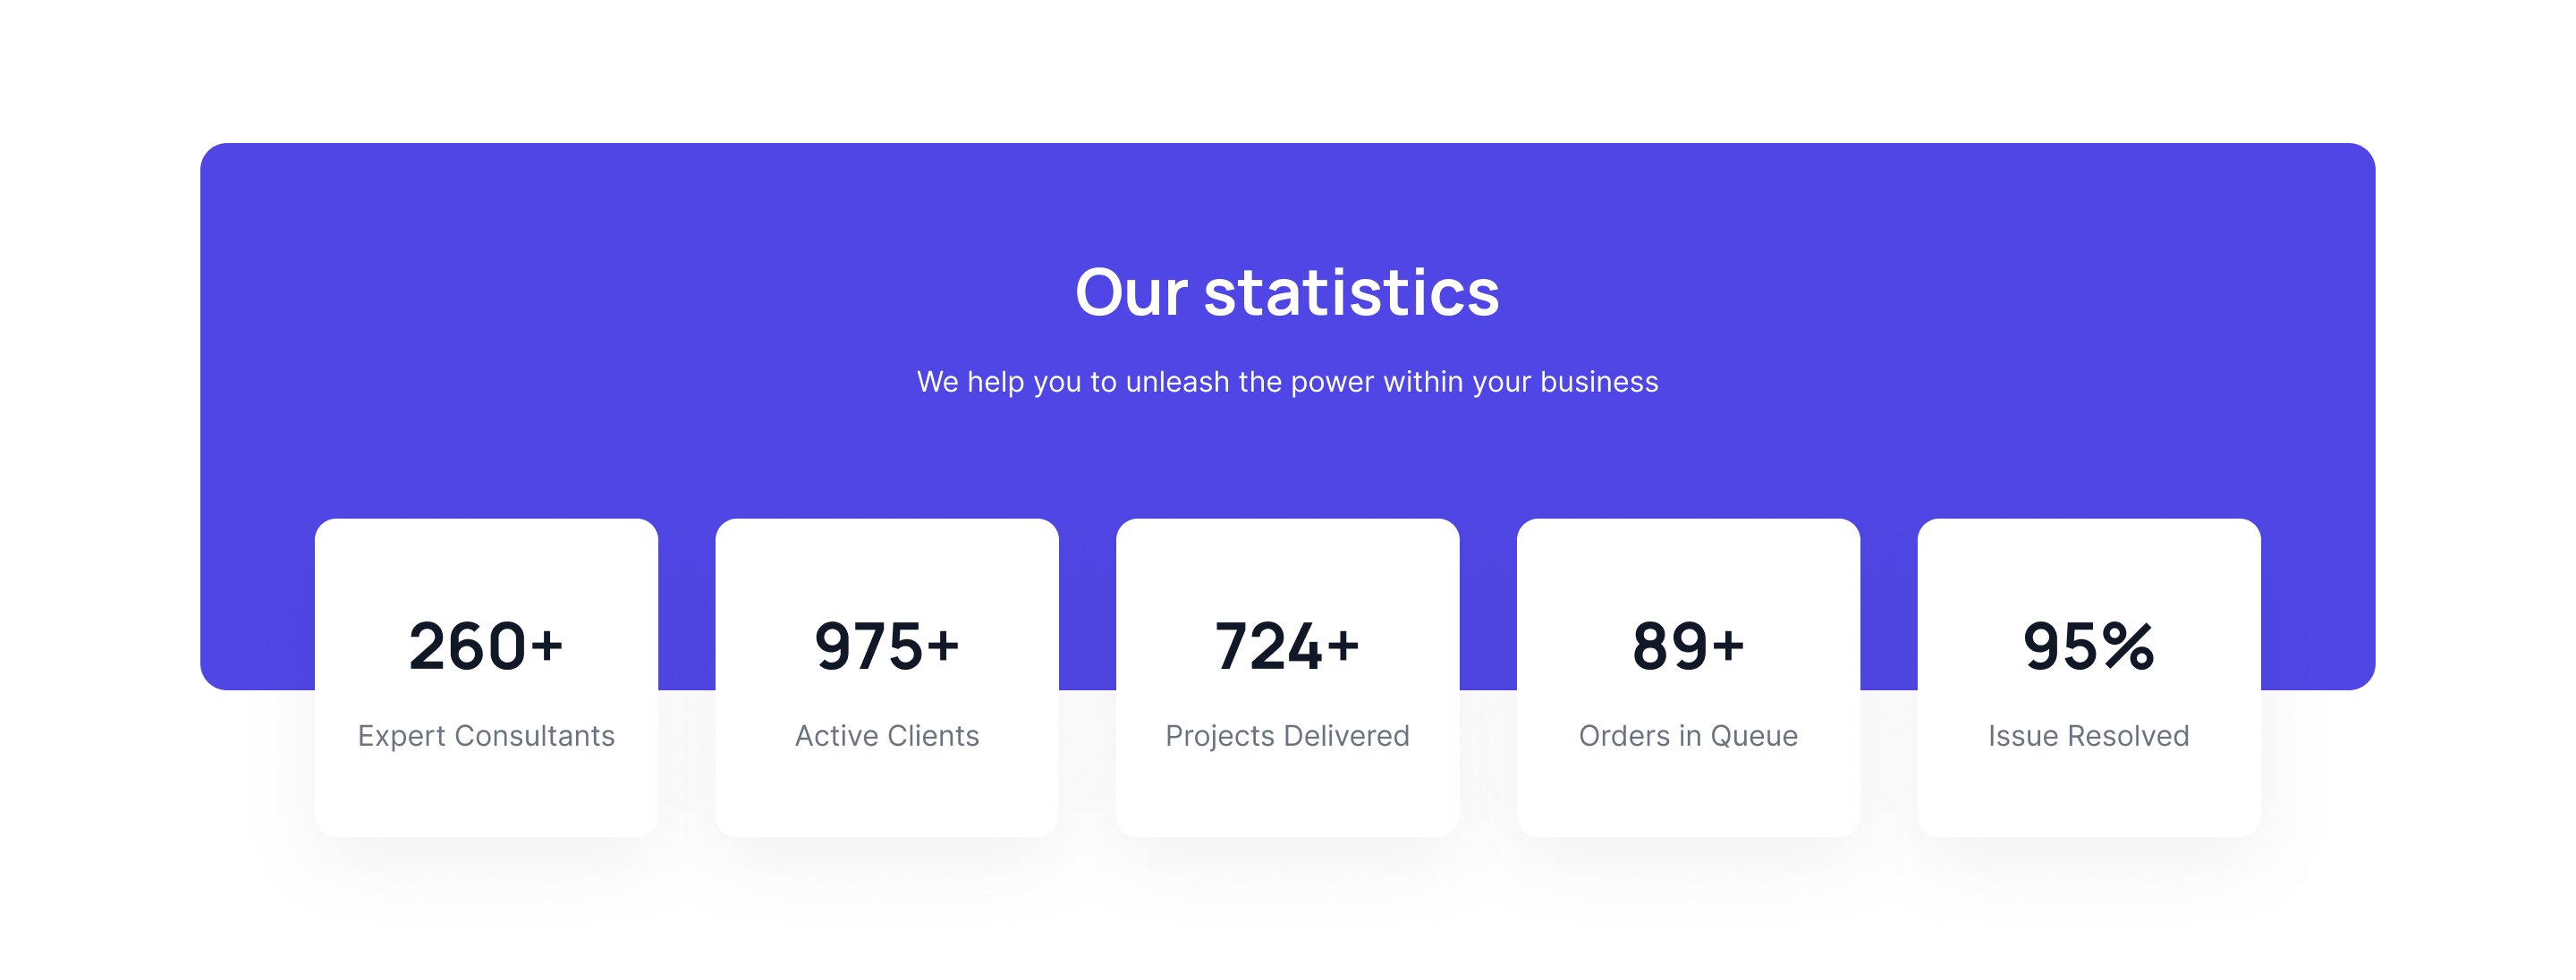
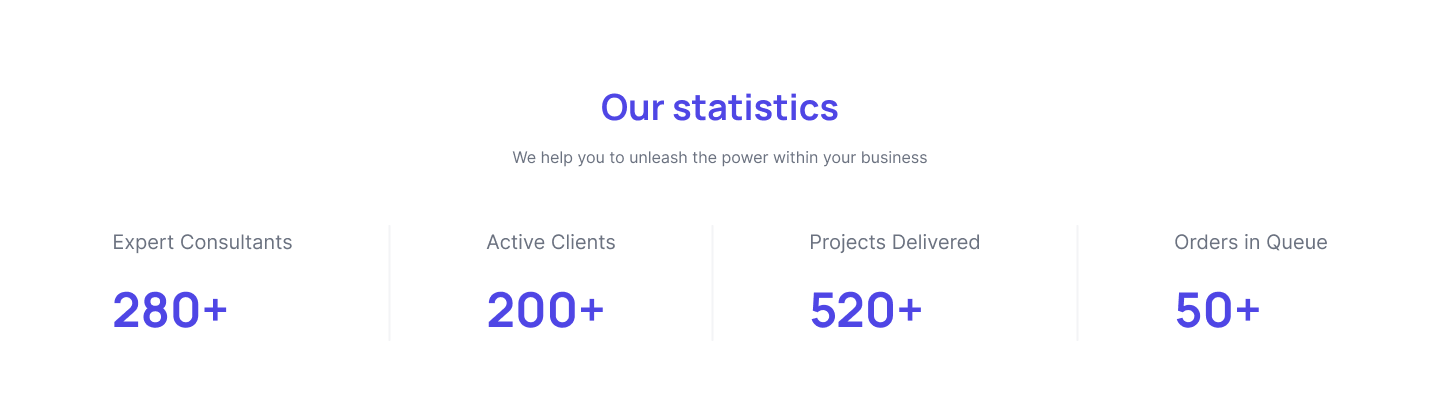
Our statistics Stats
Display four important statistics with bold numbers, clear headings, and a simple layout to showcase your business growth.
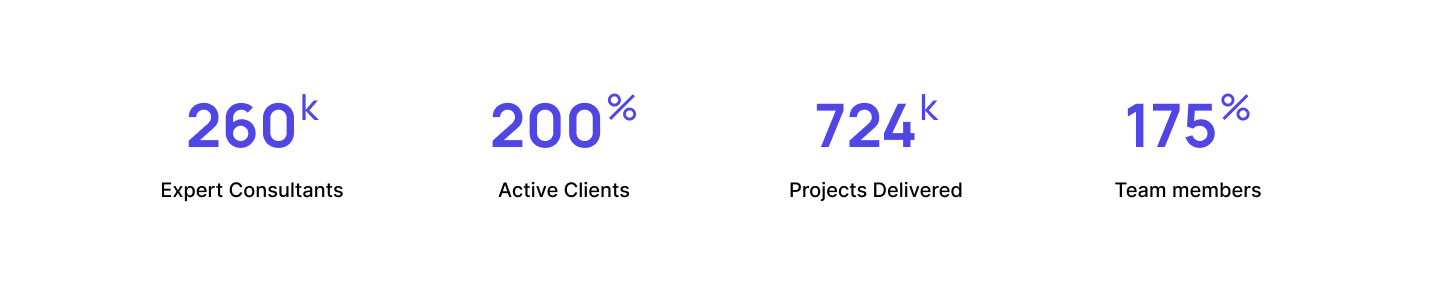
Tailwind CSS Horizontal Stats Section
Present business statistics with bold numbers, horizontal arrangement, and minimalist style for easy, impactful viewing and comparison.

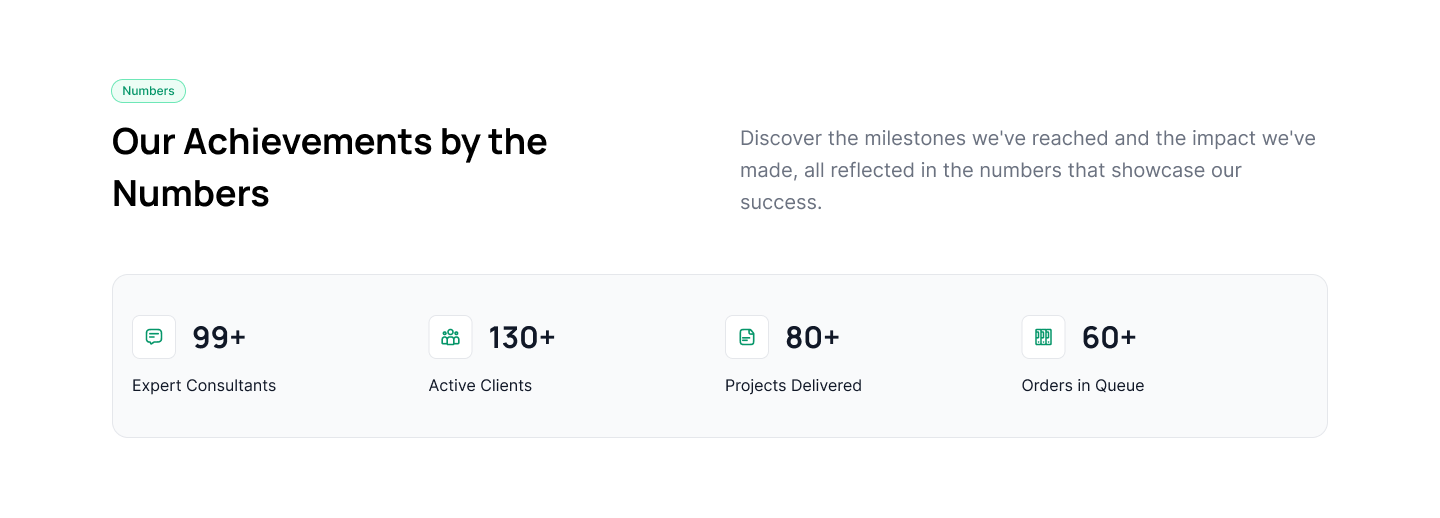
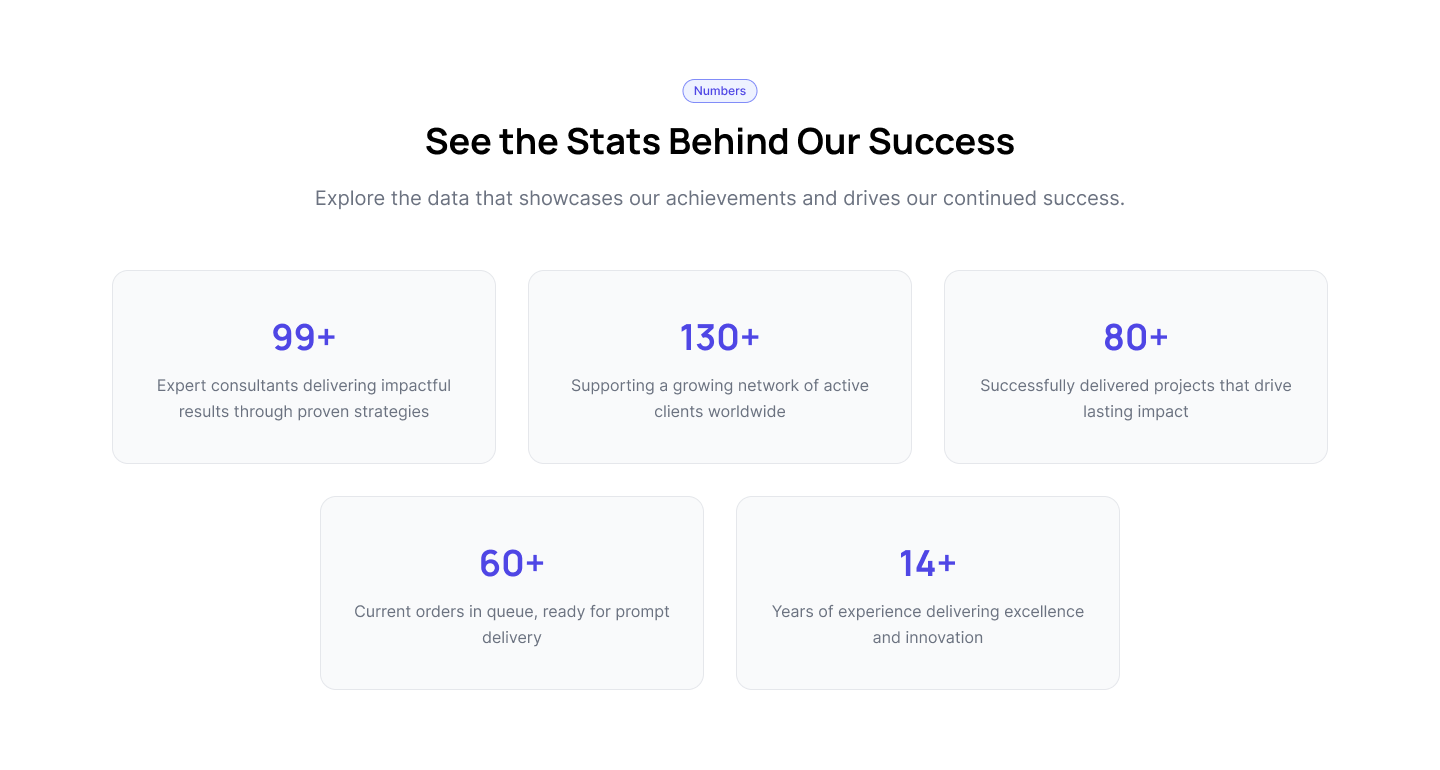
See the Stats Behind Our Success
Display achievement stats in card layout, clear headings, supporting text, and concise descriptions for each milestone and metric.
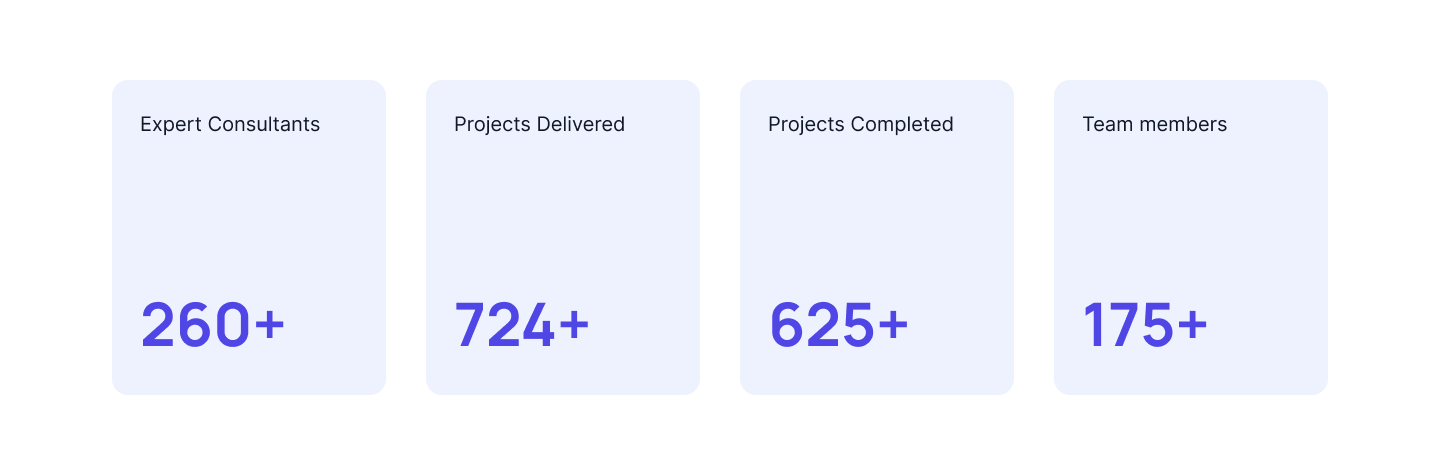
Stats with Card Layout
Show key business highlights with four stats, bold numbers, card backgrounds, and concise category labels for instant impact.
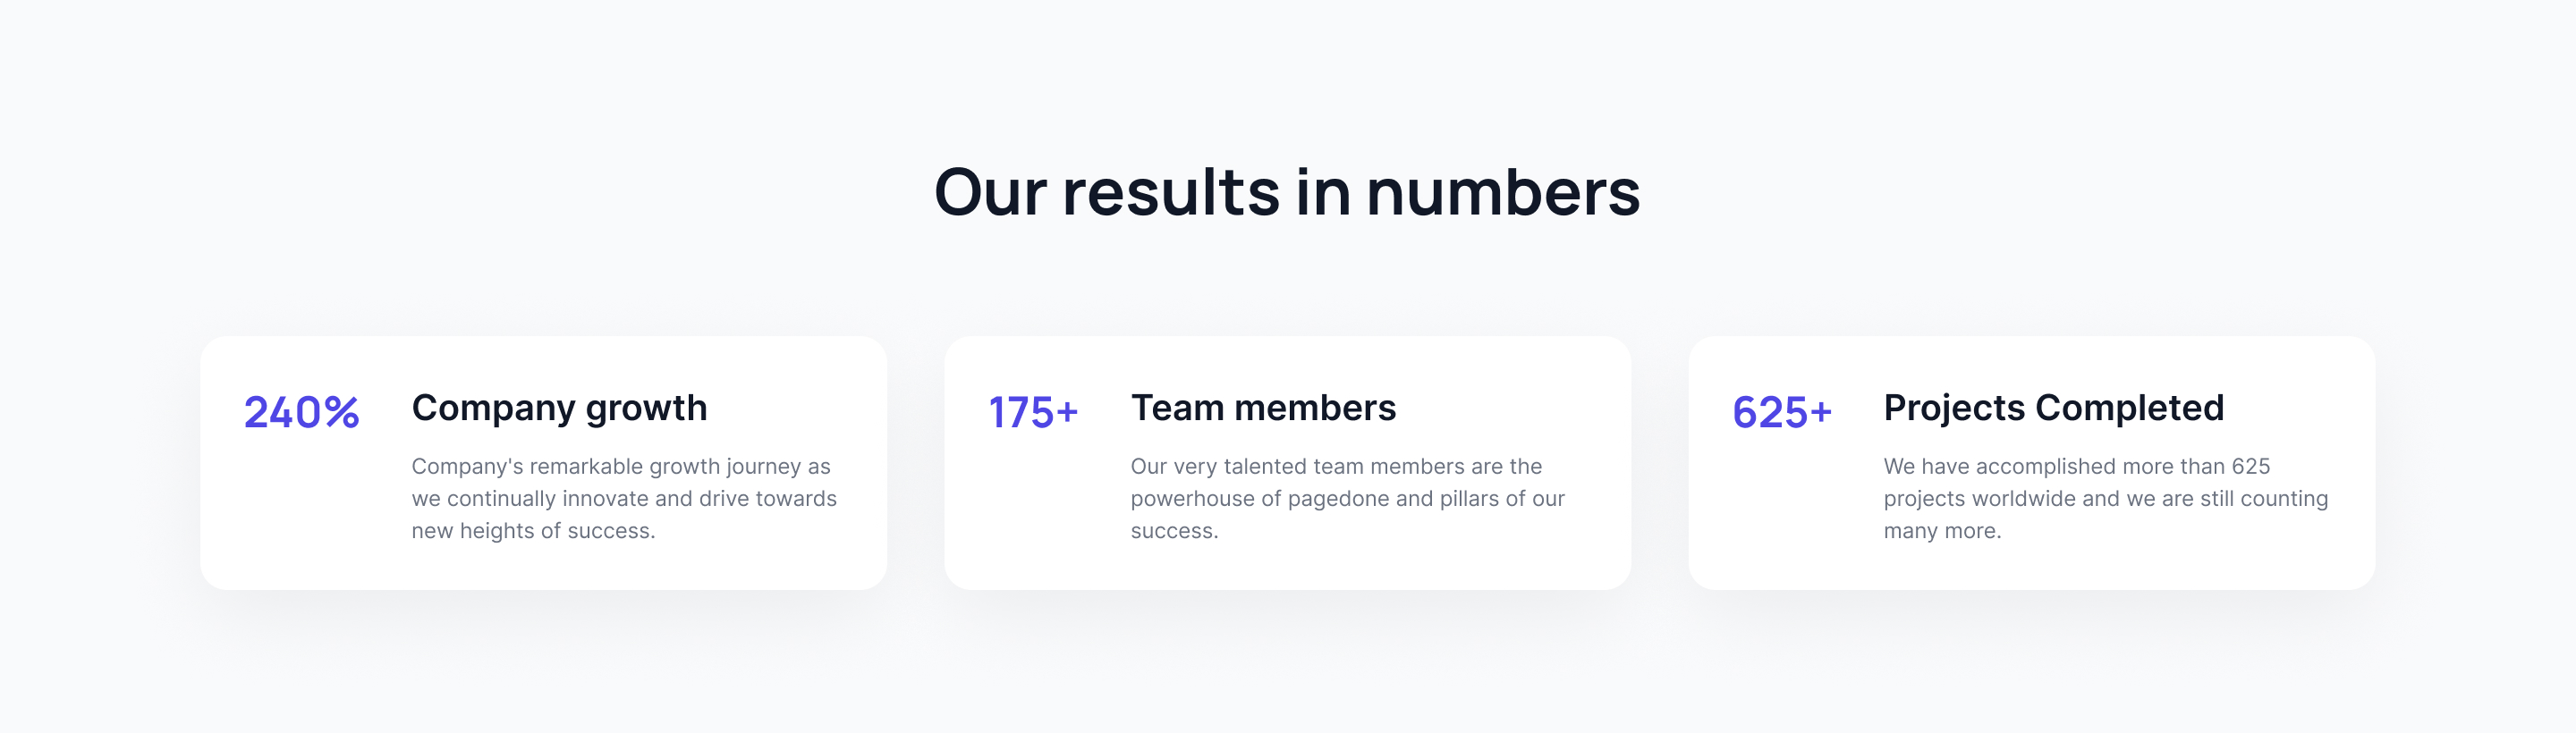
Our Growth in Numbers Stats
Showcase business progress using bold stats, clear headings, descriptive text, and call-to-action for actionable insights and engagement.
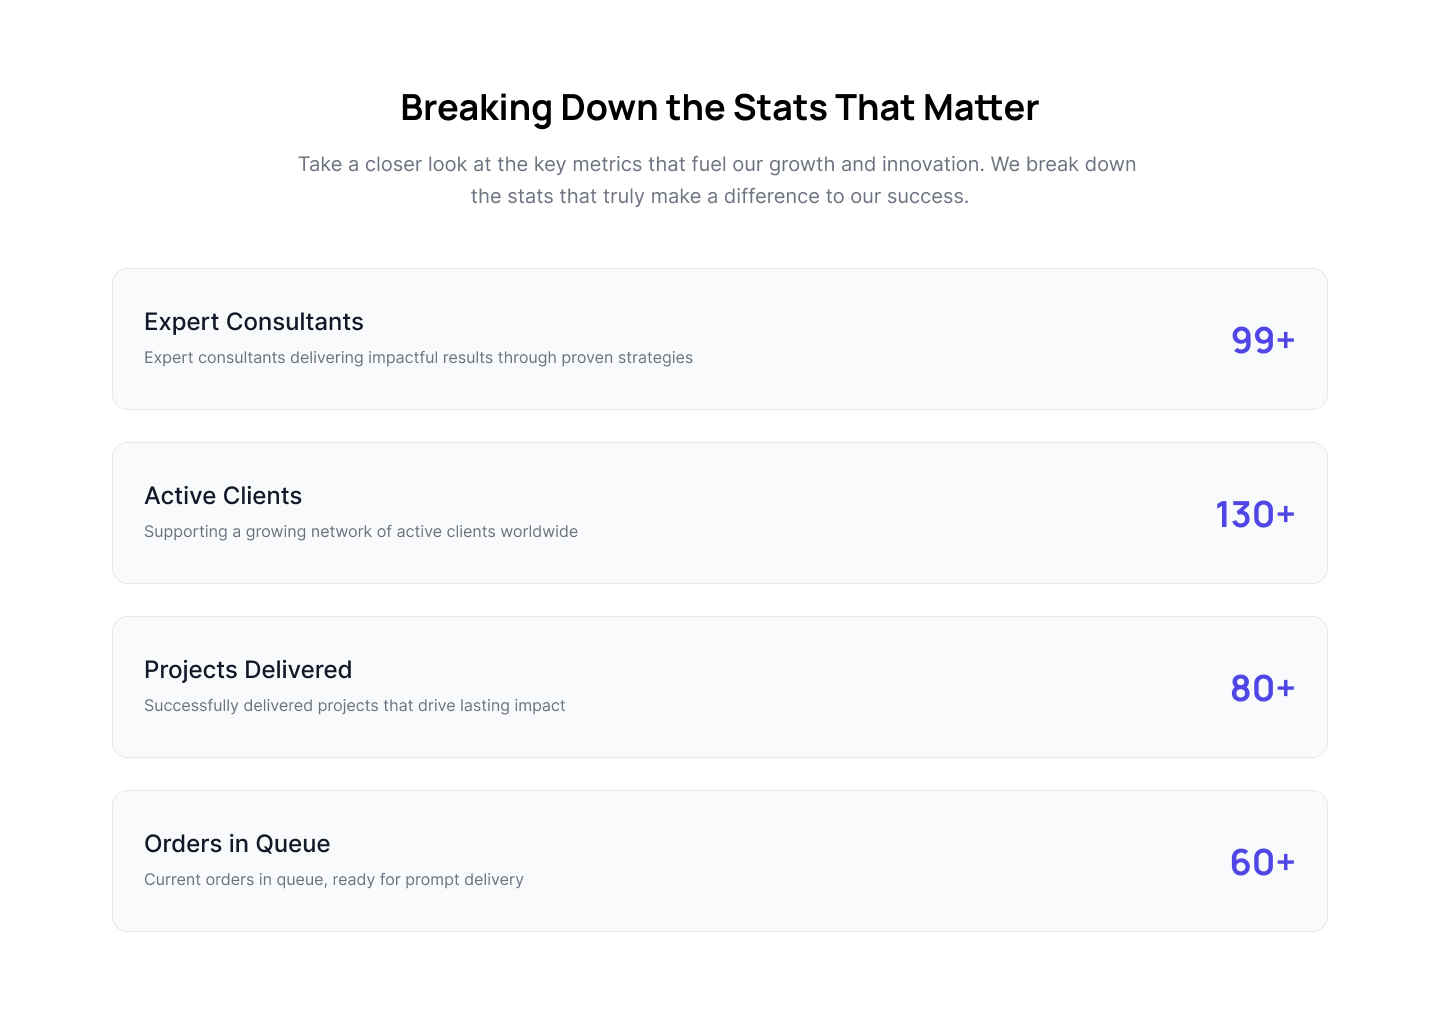
Breaking Down the Stats That Matter
List business metrics in rows, with bold numbers and clear descriptions, for quick, detailed insight into performance.
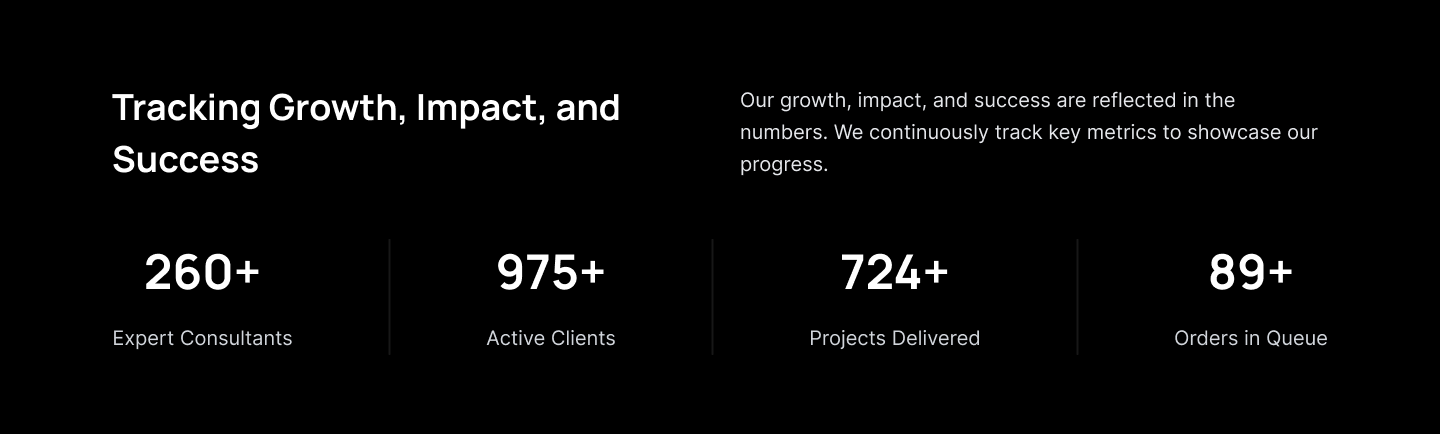
Tailwind Tracking Growth Success Stats
Showcase growth by displaying key metrics, bold numbers, brief descriptions, and a contrasting layout for clear, instant understanding.
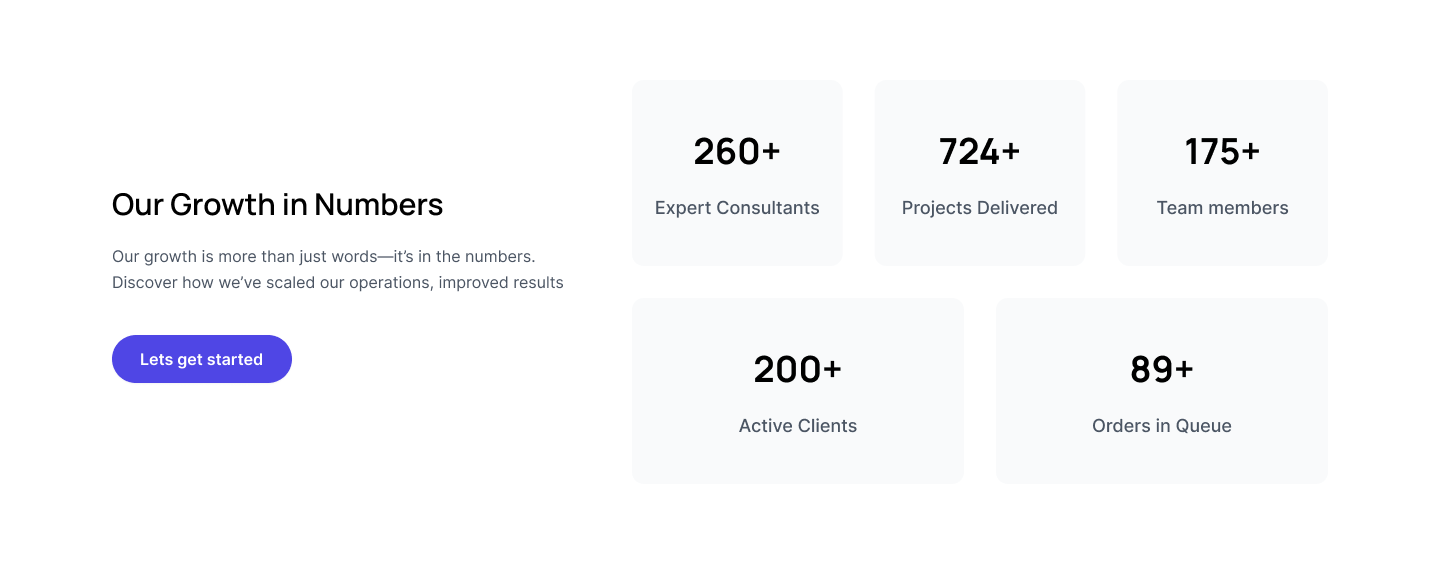
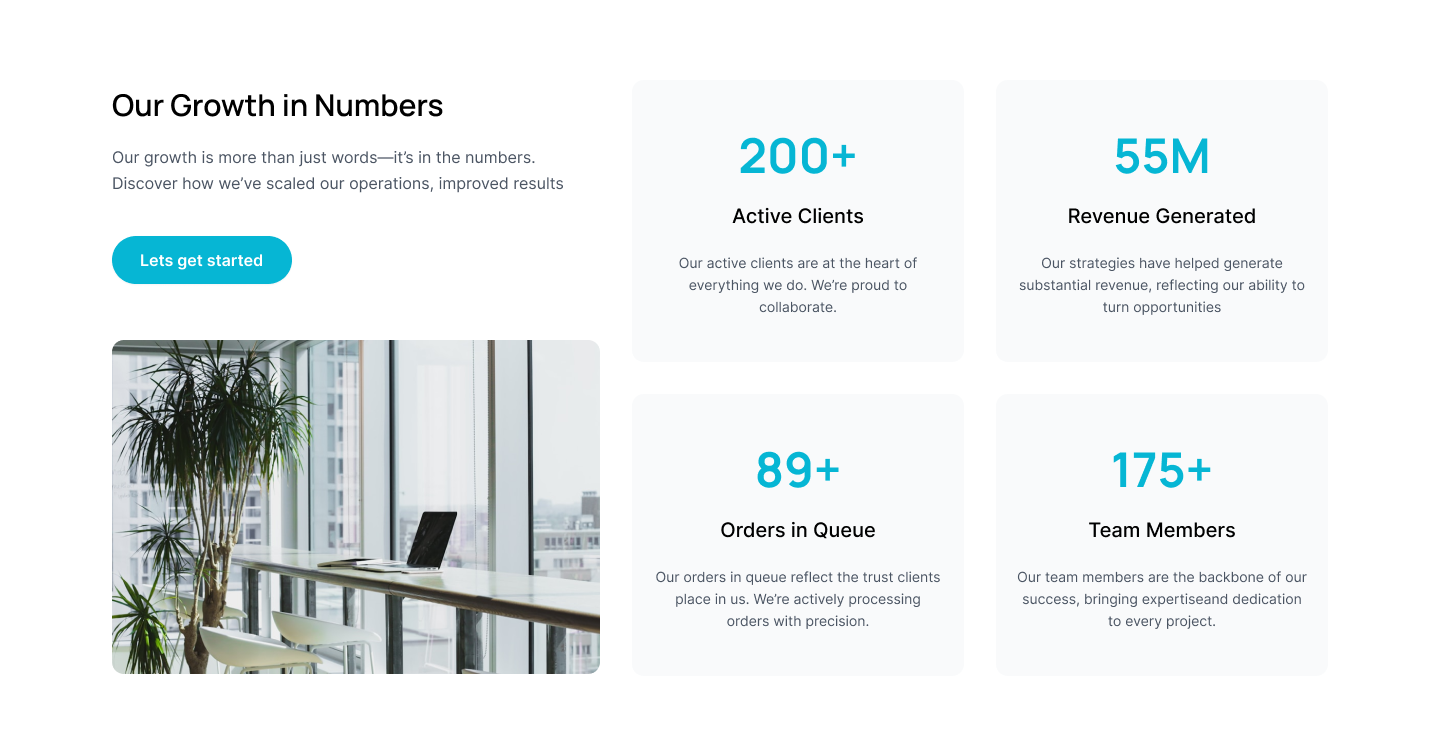
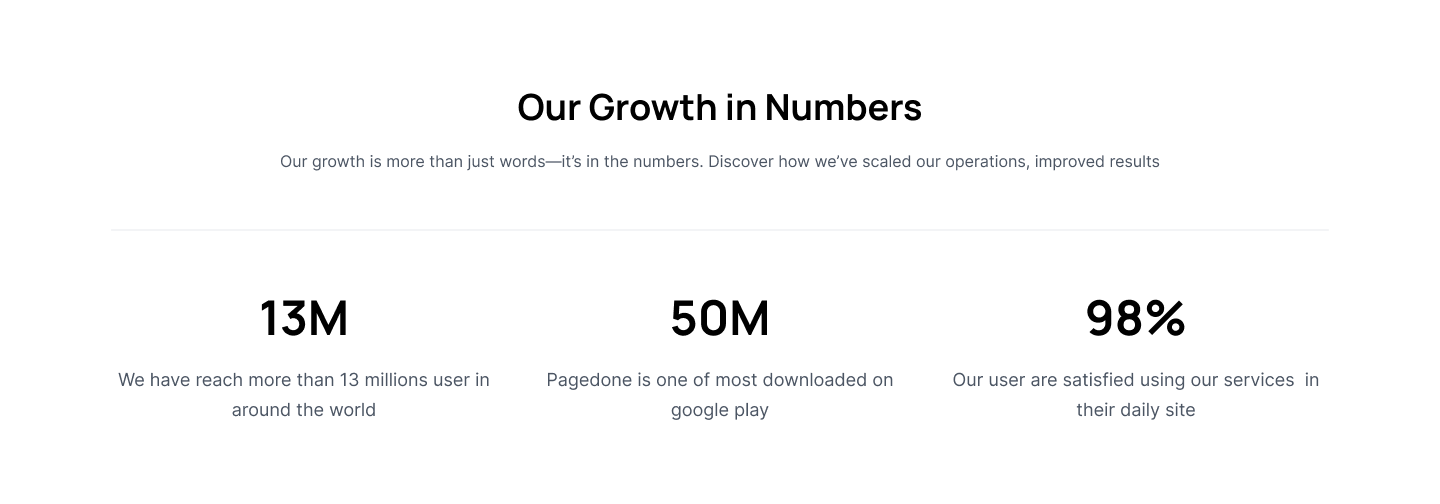
Our Growth in Numbers
Display business milestones with modern cards, category labels, concise explanations, and a call-to-action for new opportunities.
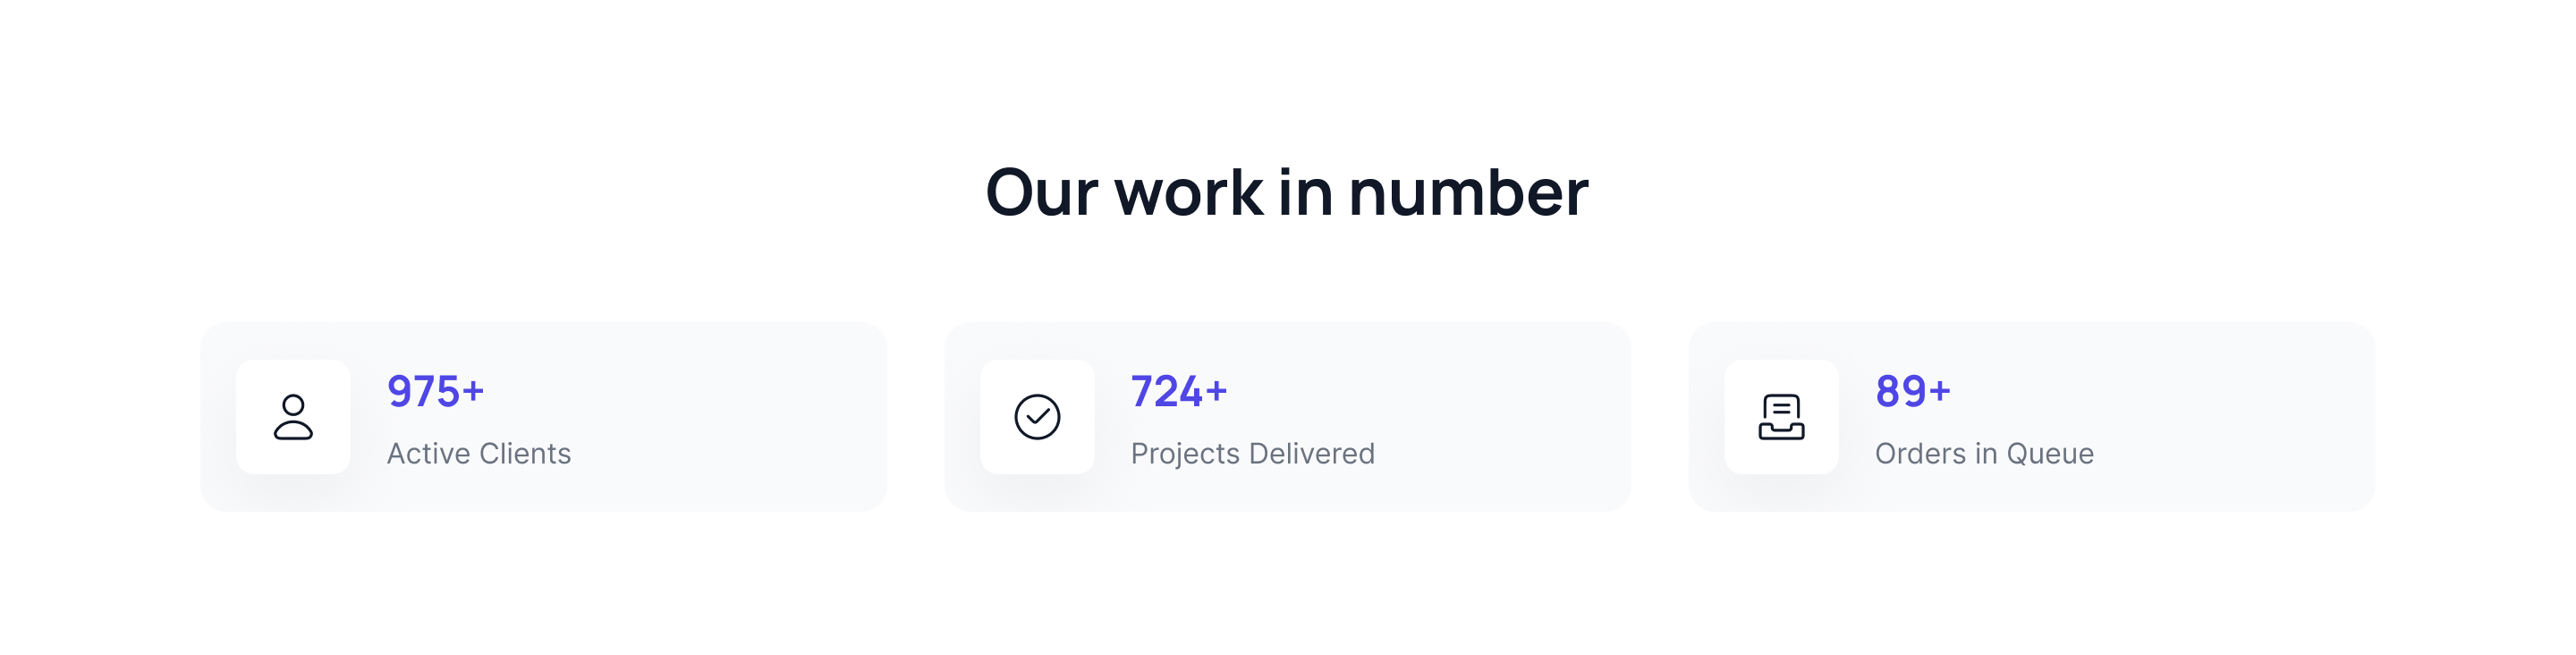
Stats with Indicators
Present key business stats with bold numbers and clear indicators for instant, impactful review and comparison.
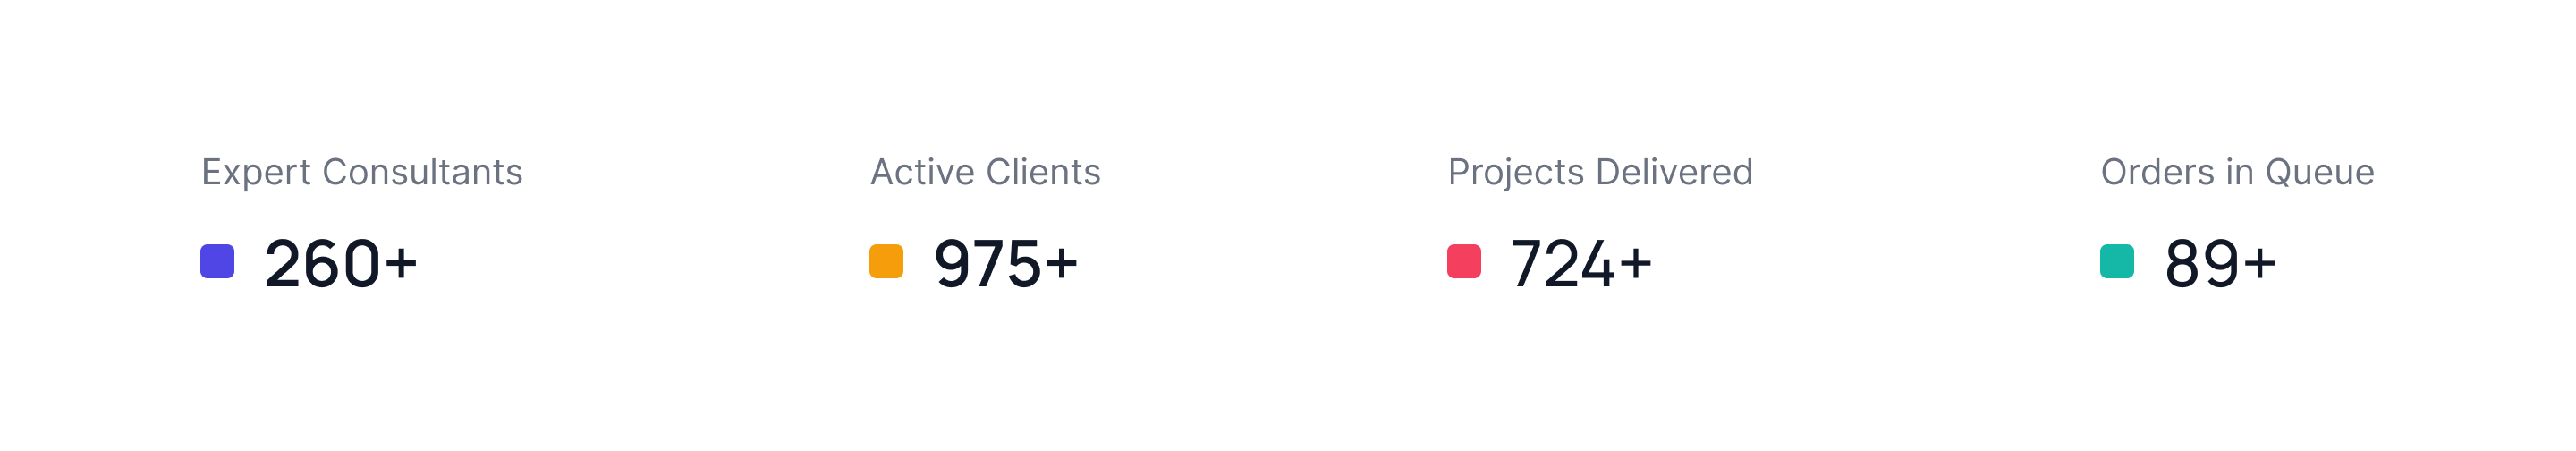
Stats with Custom Icon
Showcase achievements with colored icons, bold stats, and simple labels for clear, effective metric display.

Performance Insight and Analytics
Show key analytics stats with icons and brief descriptions for actionable and quick business insights.

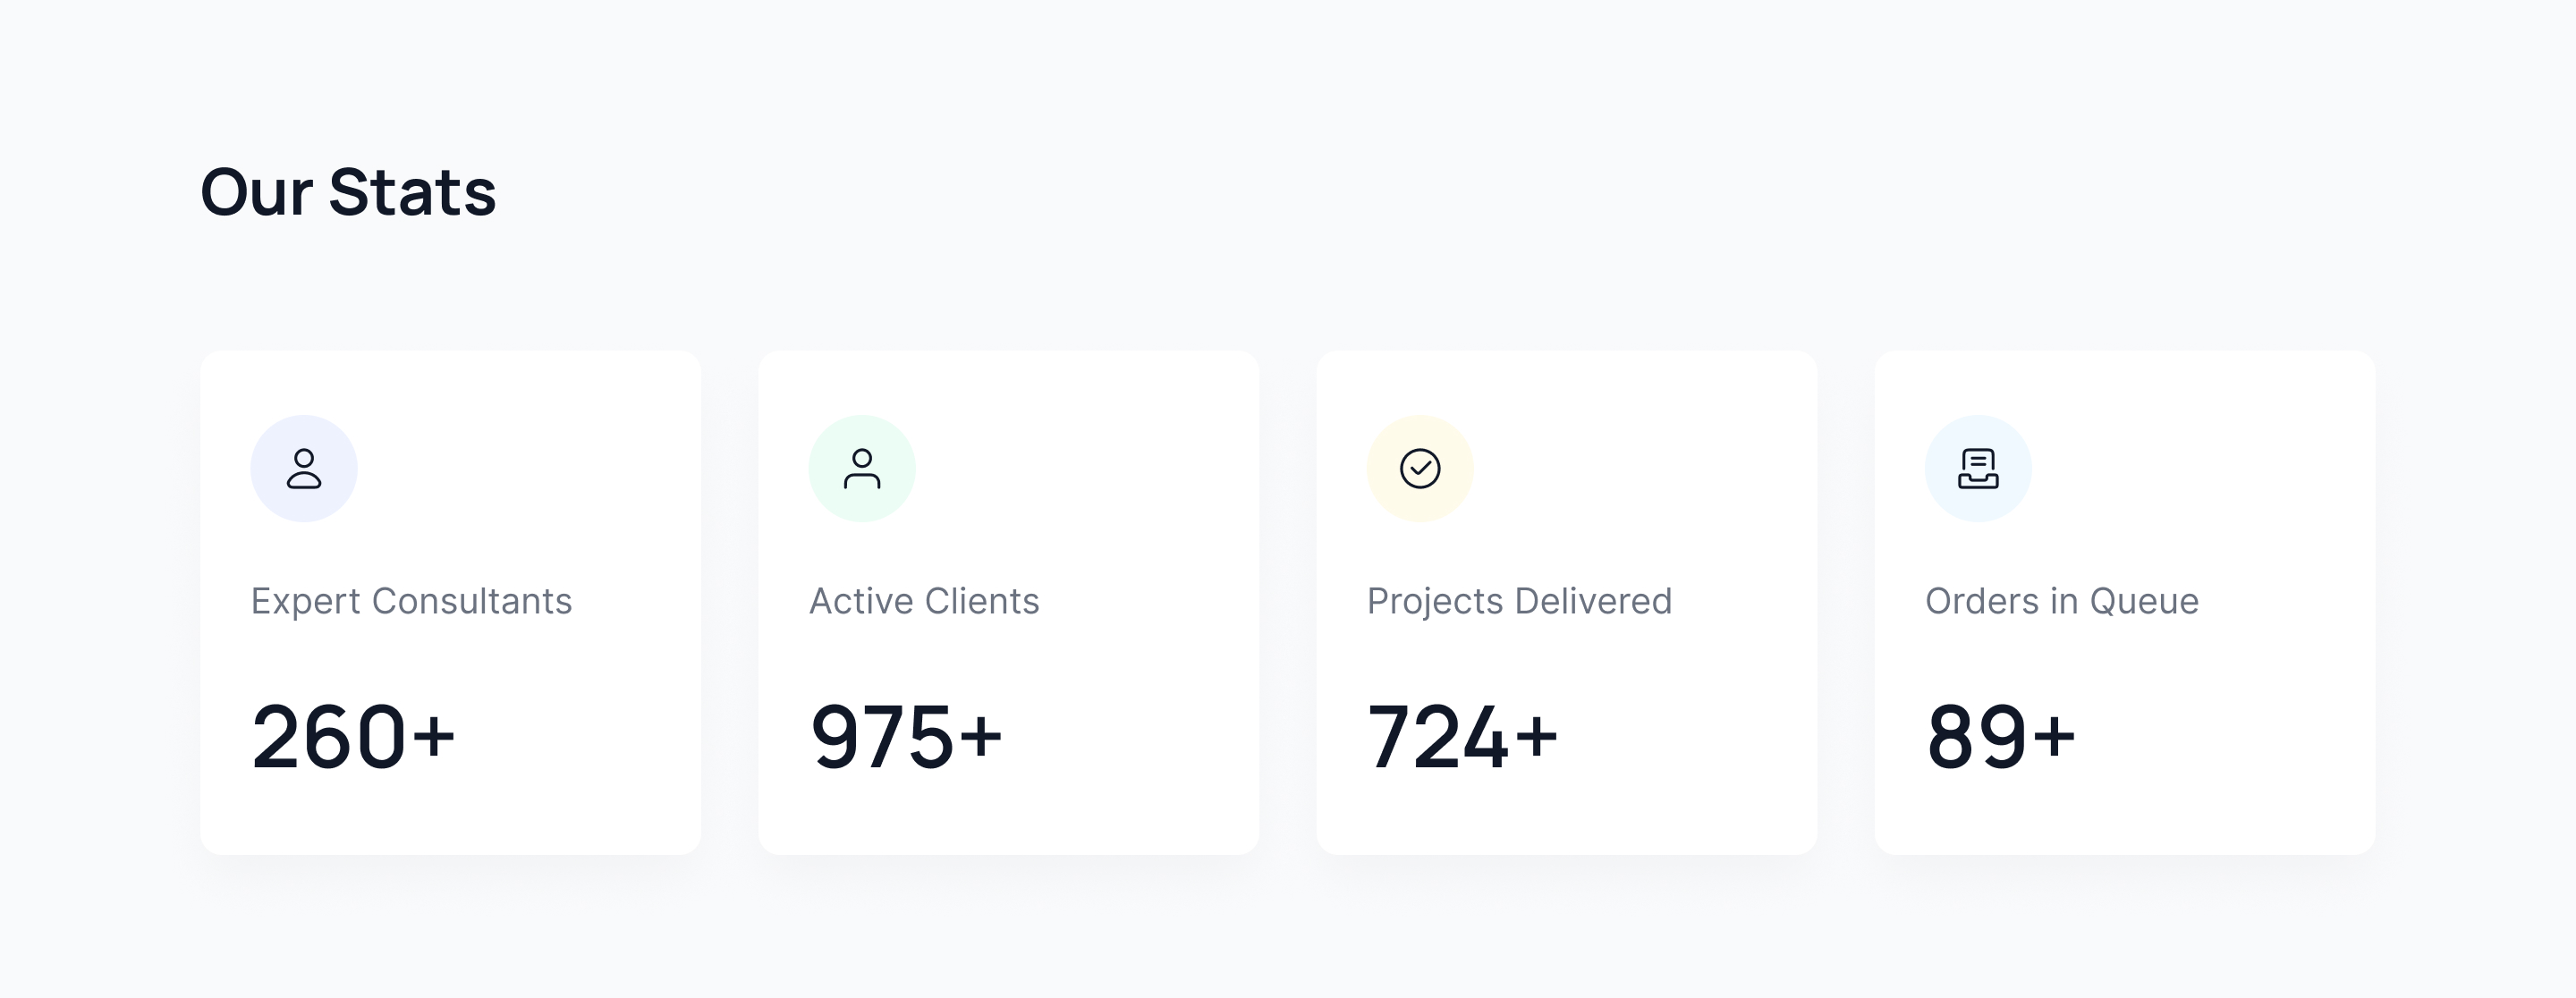
Stats with Icon Background
Display business stats with colored icon backgrounds, bold numbers, and clear categories for maximum visual impact.

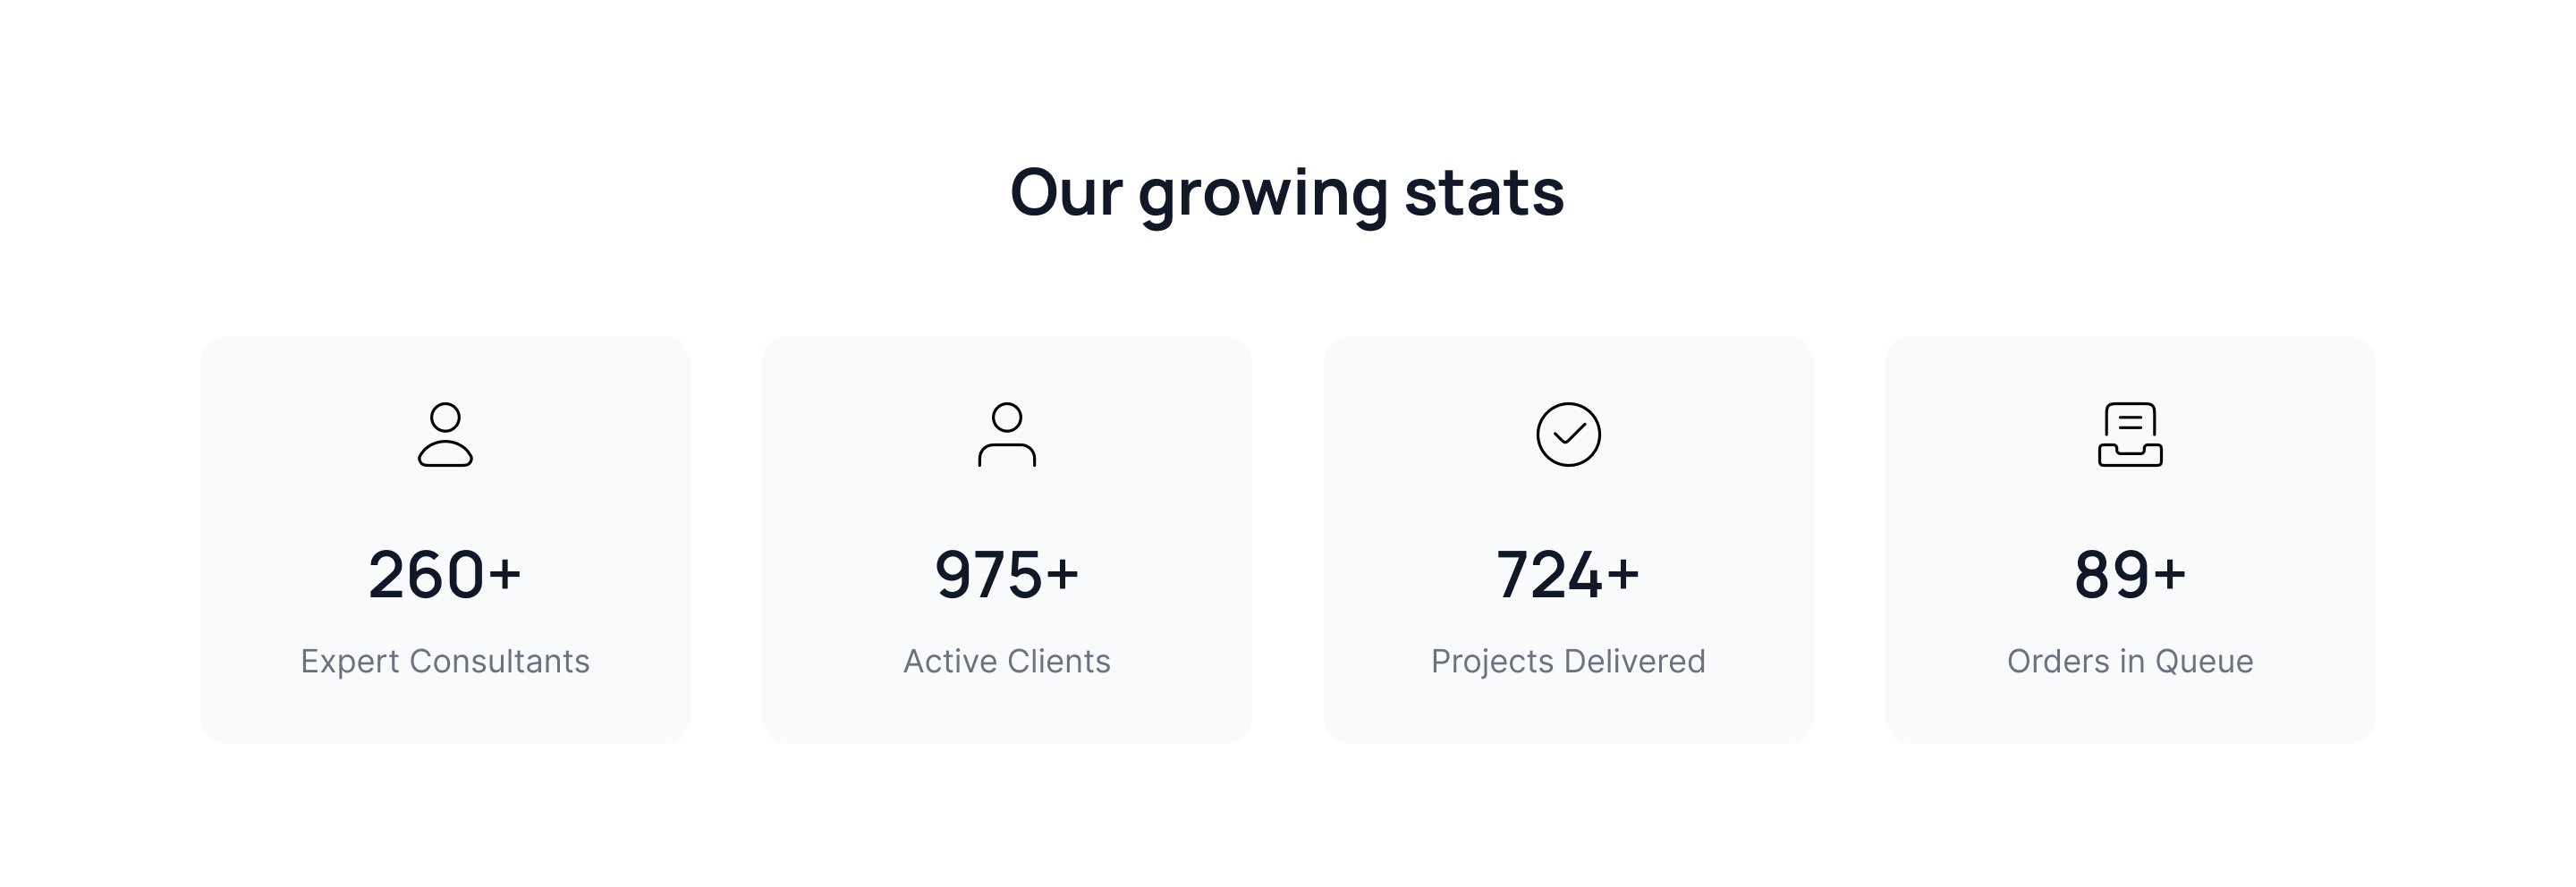
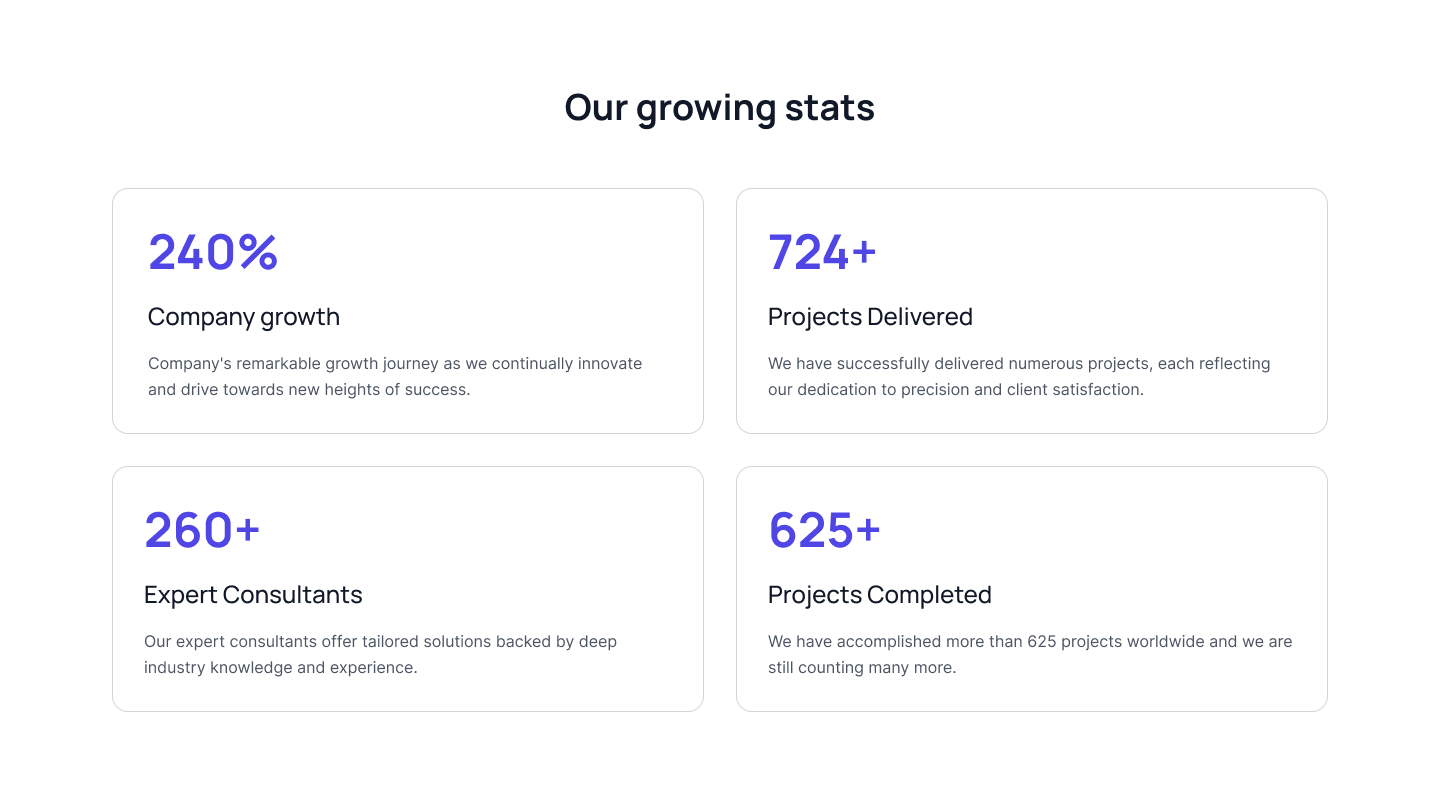
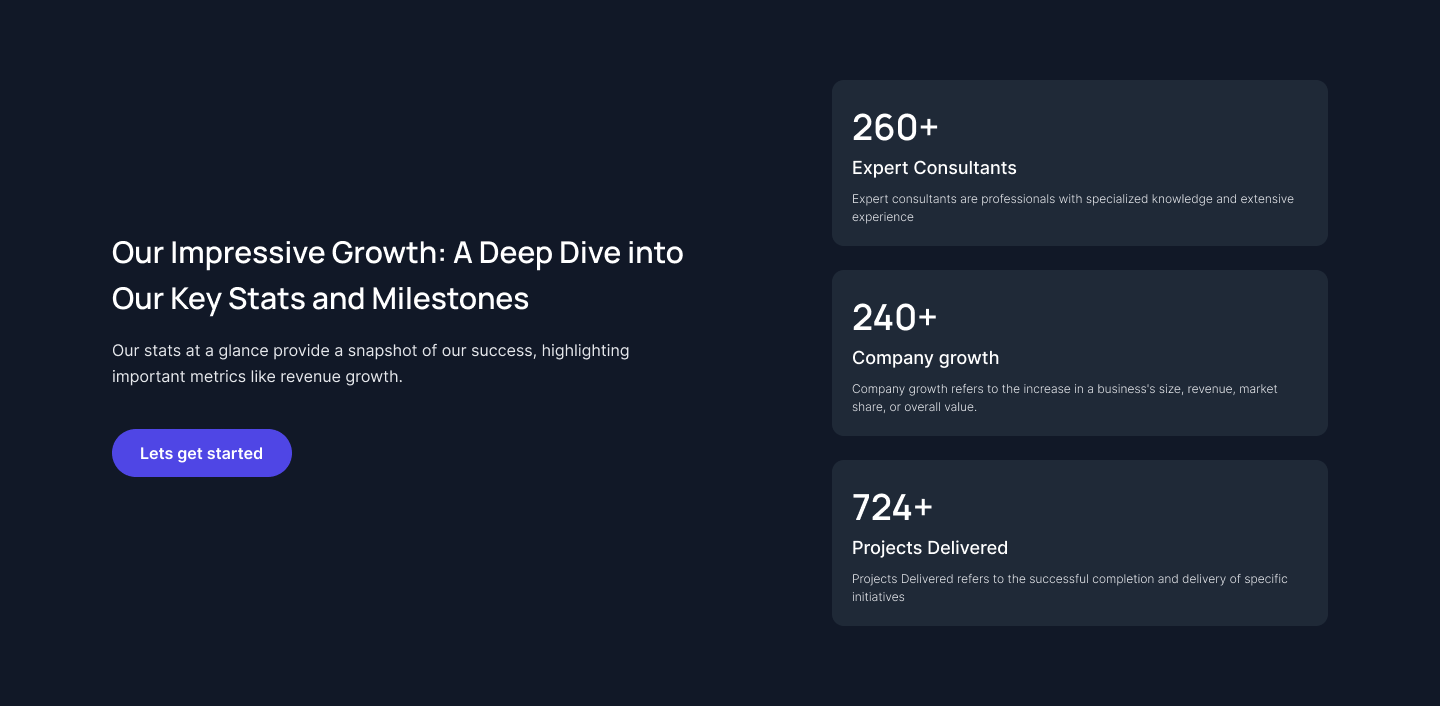
Our Growing Stats
Highlight company growth, expert consultants, and project metrics with card layout and detailed supporting text.
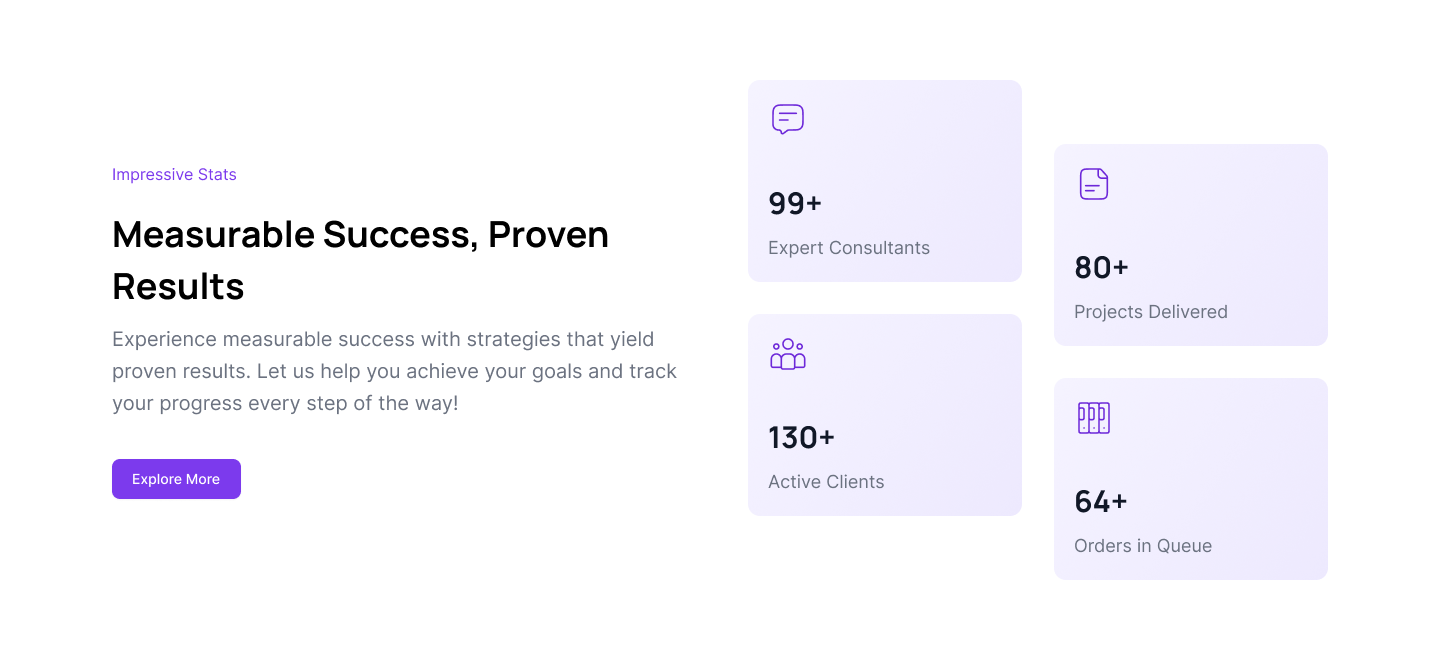
Tailwind CSS Impressive Stats
Highlight proven results with card-based layout, bold numbers, icons, and actionable headline for instant credibility.
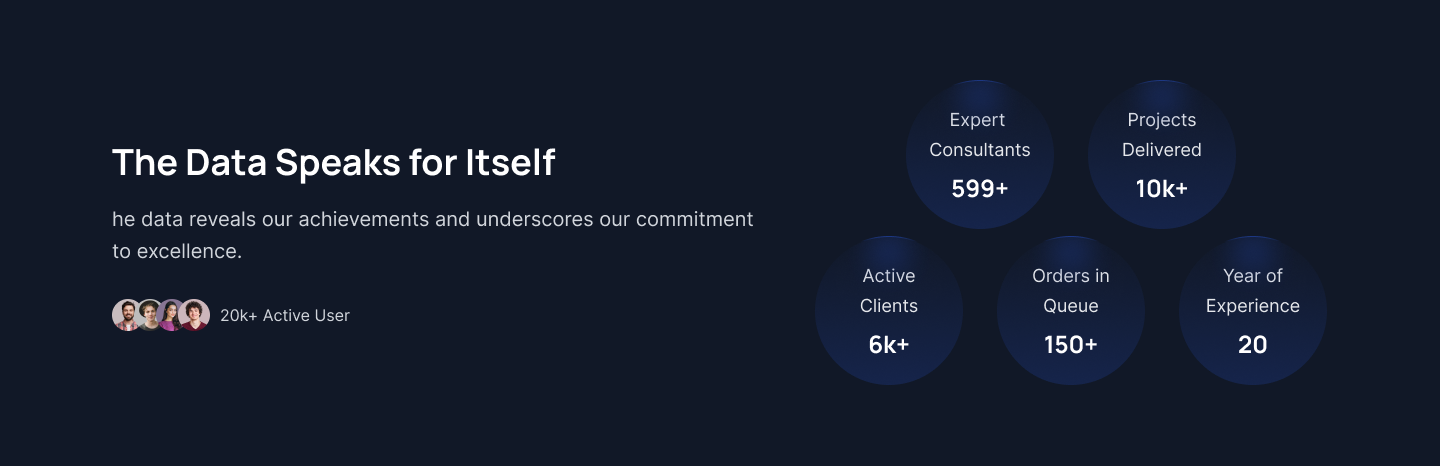
The Data Speaks for Itself Stats
Present key achievements in a bubble layout, with user avatars and concise stats for instant credibility.
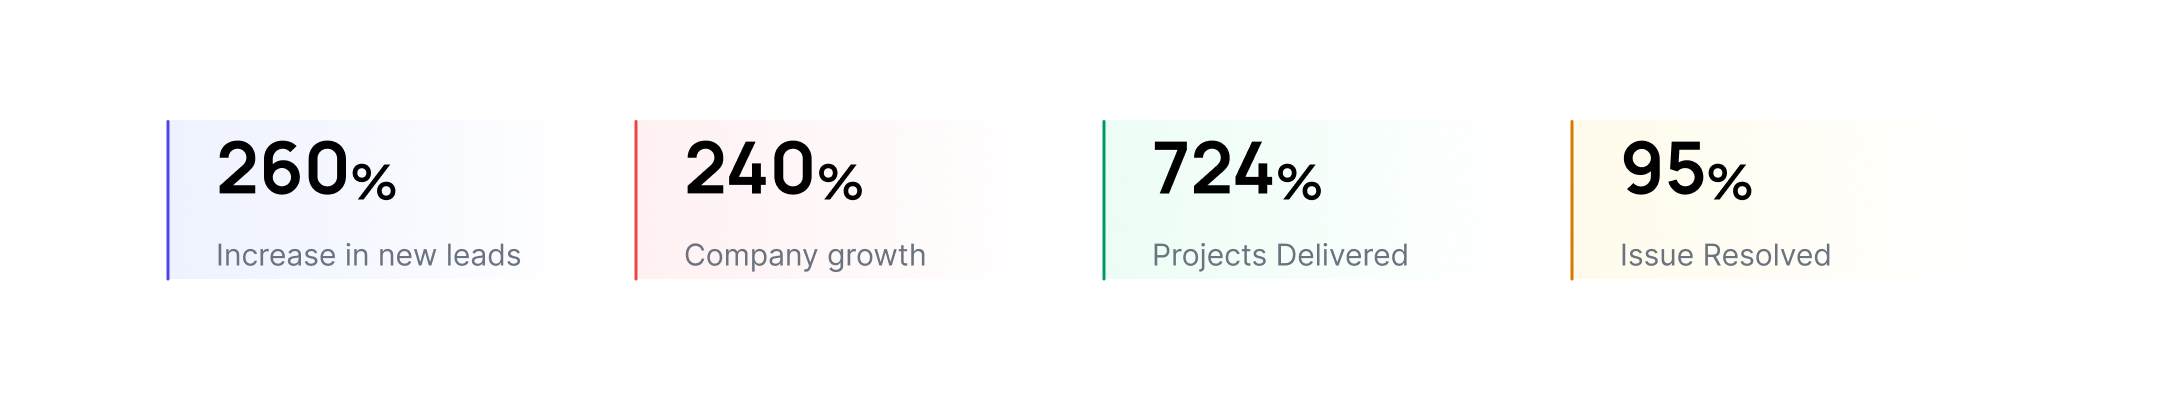
Stats with Custom Colour
Show key achievements with colored highlights for each stat, instantly showcasing progress and resolved issues.
Key Stats and Milestones Overview
Use stacked layout with milestone descriptions, concise numbers, and highlights to showcase impressive business growth.
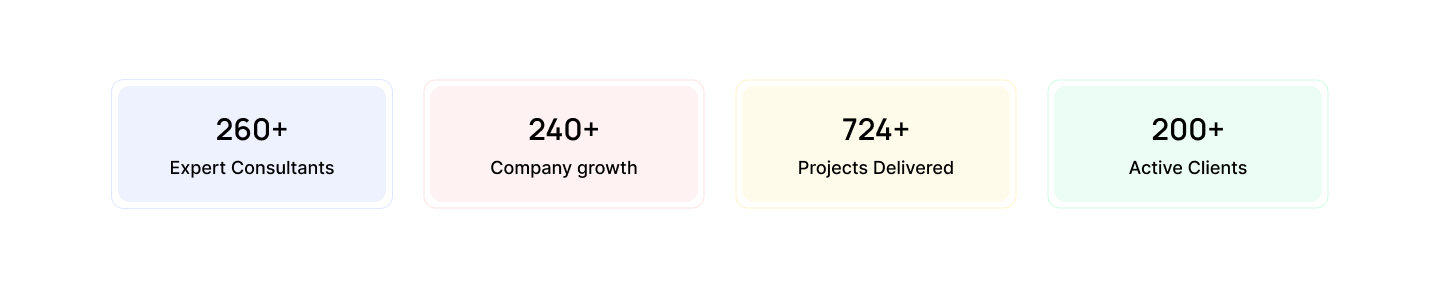
Horizontal Stats with Card Style
Display four key business stats in colored cards, with bold numbers and clear category labels for instant recognition.
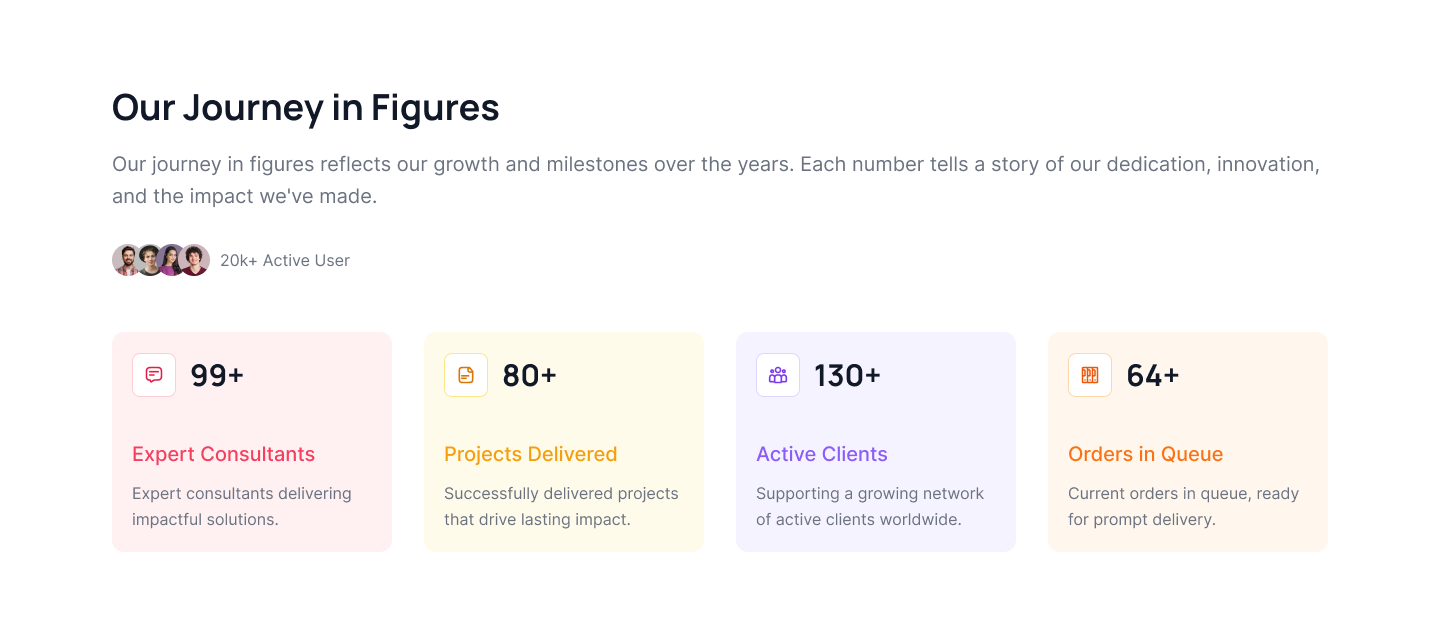
Tailwind Stats Our Journey in Figures
Display journey highlights in colored cards, with team avatars, bold stats, and clear category labels for impact.
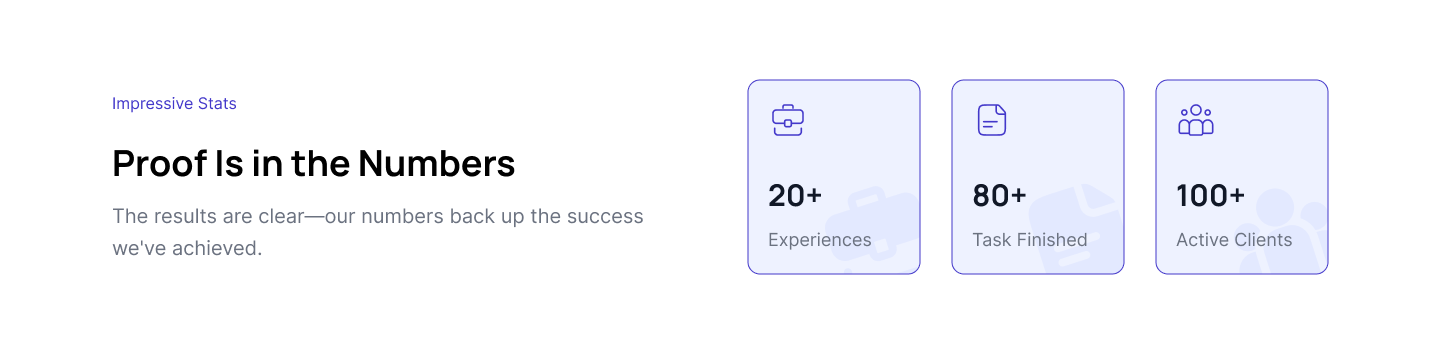
Impressive Stats
Show clear results with icon cards, bold stats, and supportive headline for expert experience, delivered tasks, and clients.
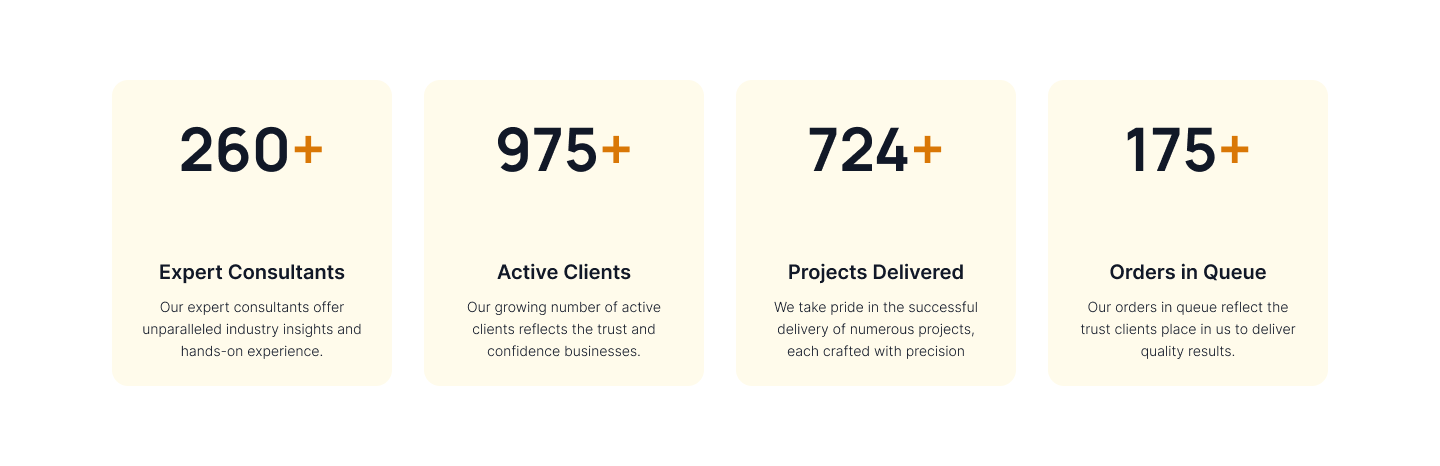
Stats Card with Highlight
Highlight achievements in pale yellow cards, with bold stats, plus sign accents, and detailed category labels.
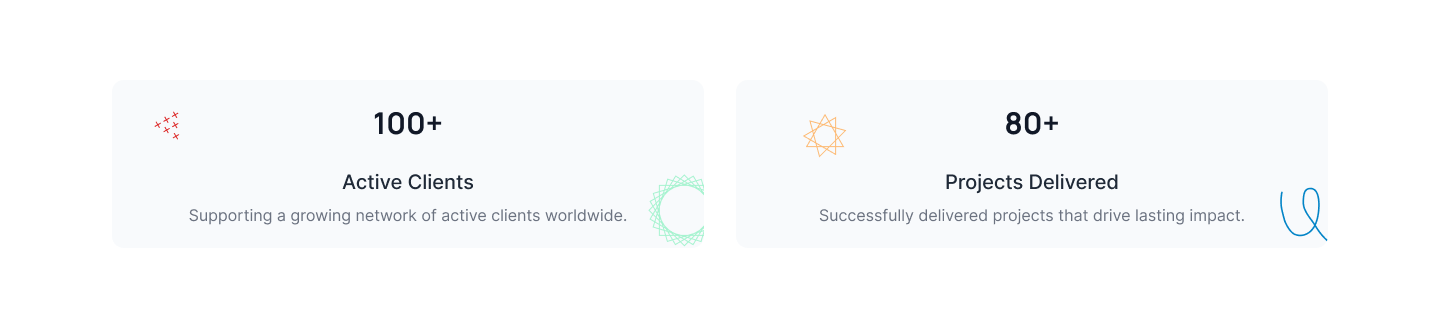
Stats with Creative Card Design
Showcase two business stats with soft backgrounds, bold numbers, and playful corner icons for visual interest.
Our Growth Stats with Numbers
Highlight business reach, downloads, and satisfaction with bold stats and concise supporting captions for instant impact.
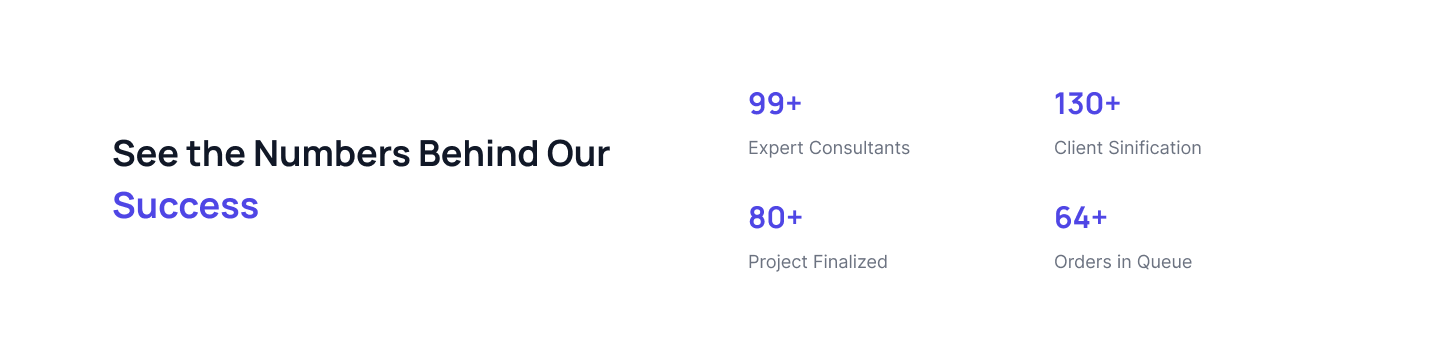
Our Success Stats
Present key business stats in two-column layout, bold numbers, and clear category labels for instant understanding.
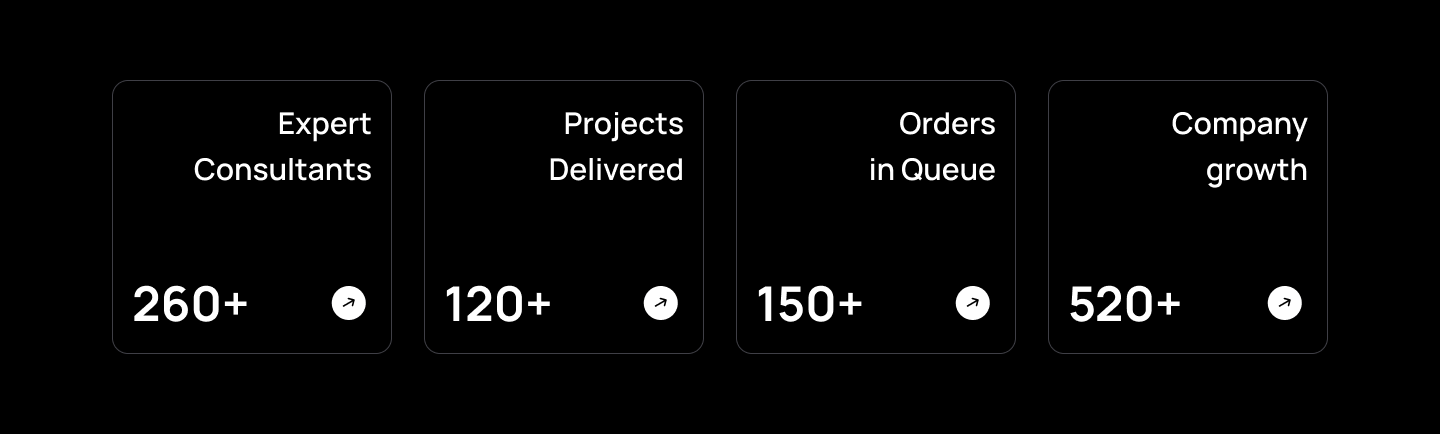
Stats with Border and Actions
Display stats in bordered cards, large numbers, category labels, and arrow actions for interactive metric review.
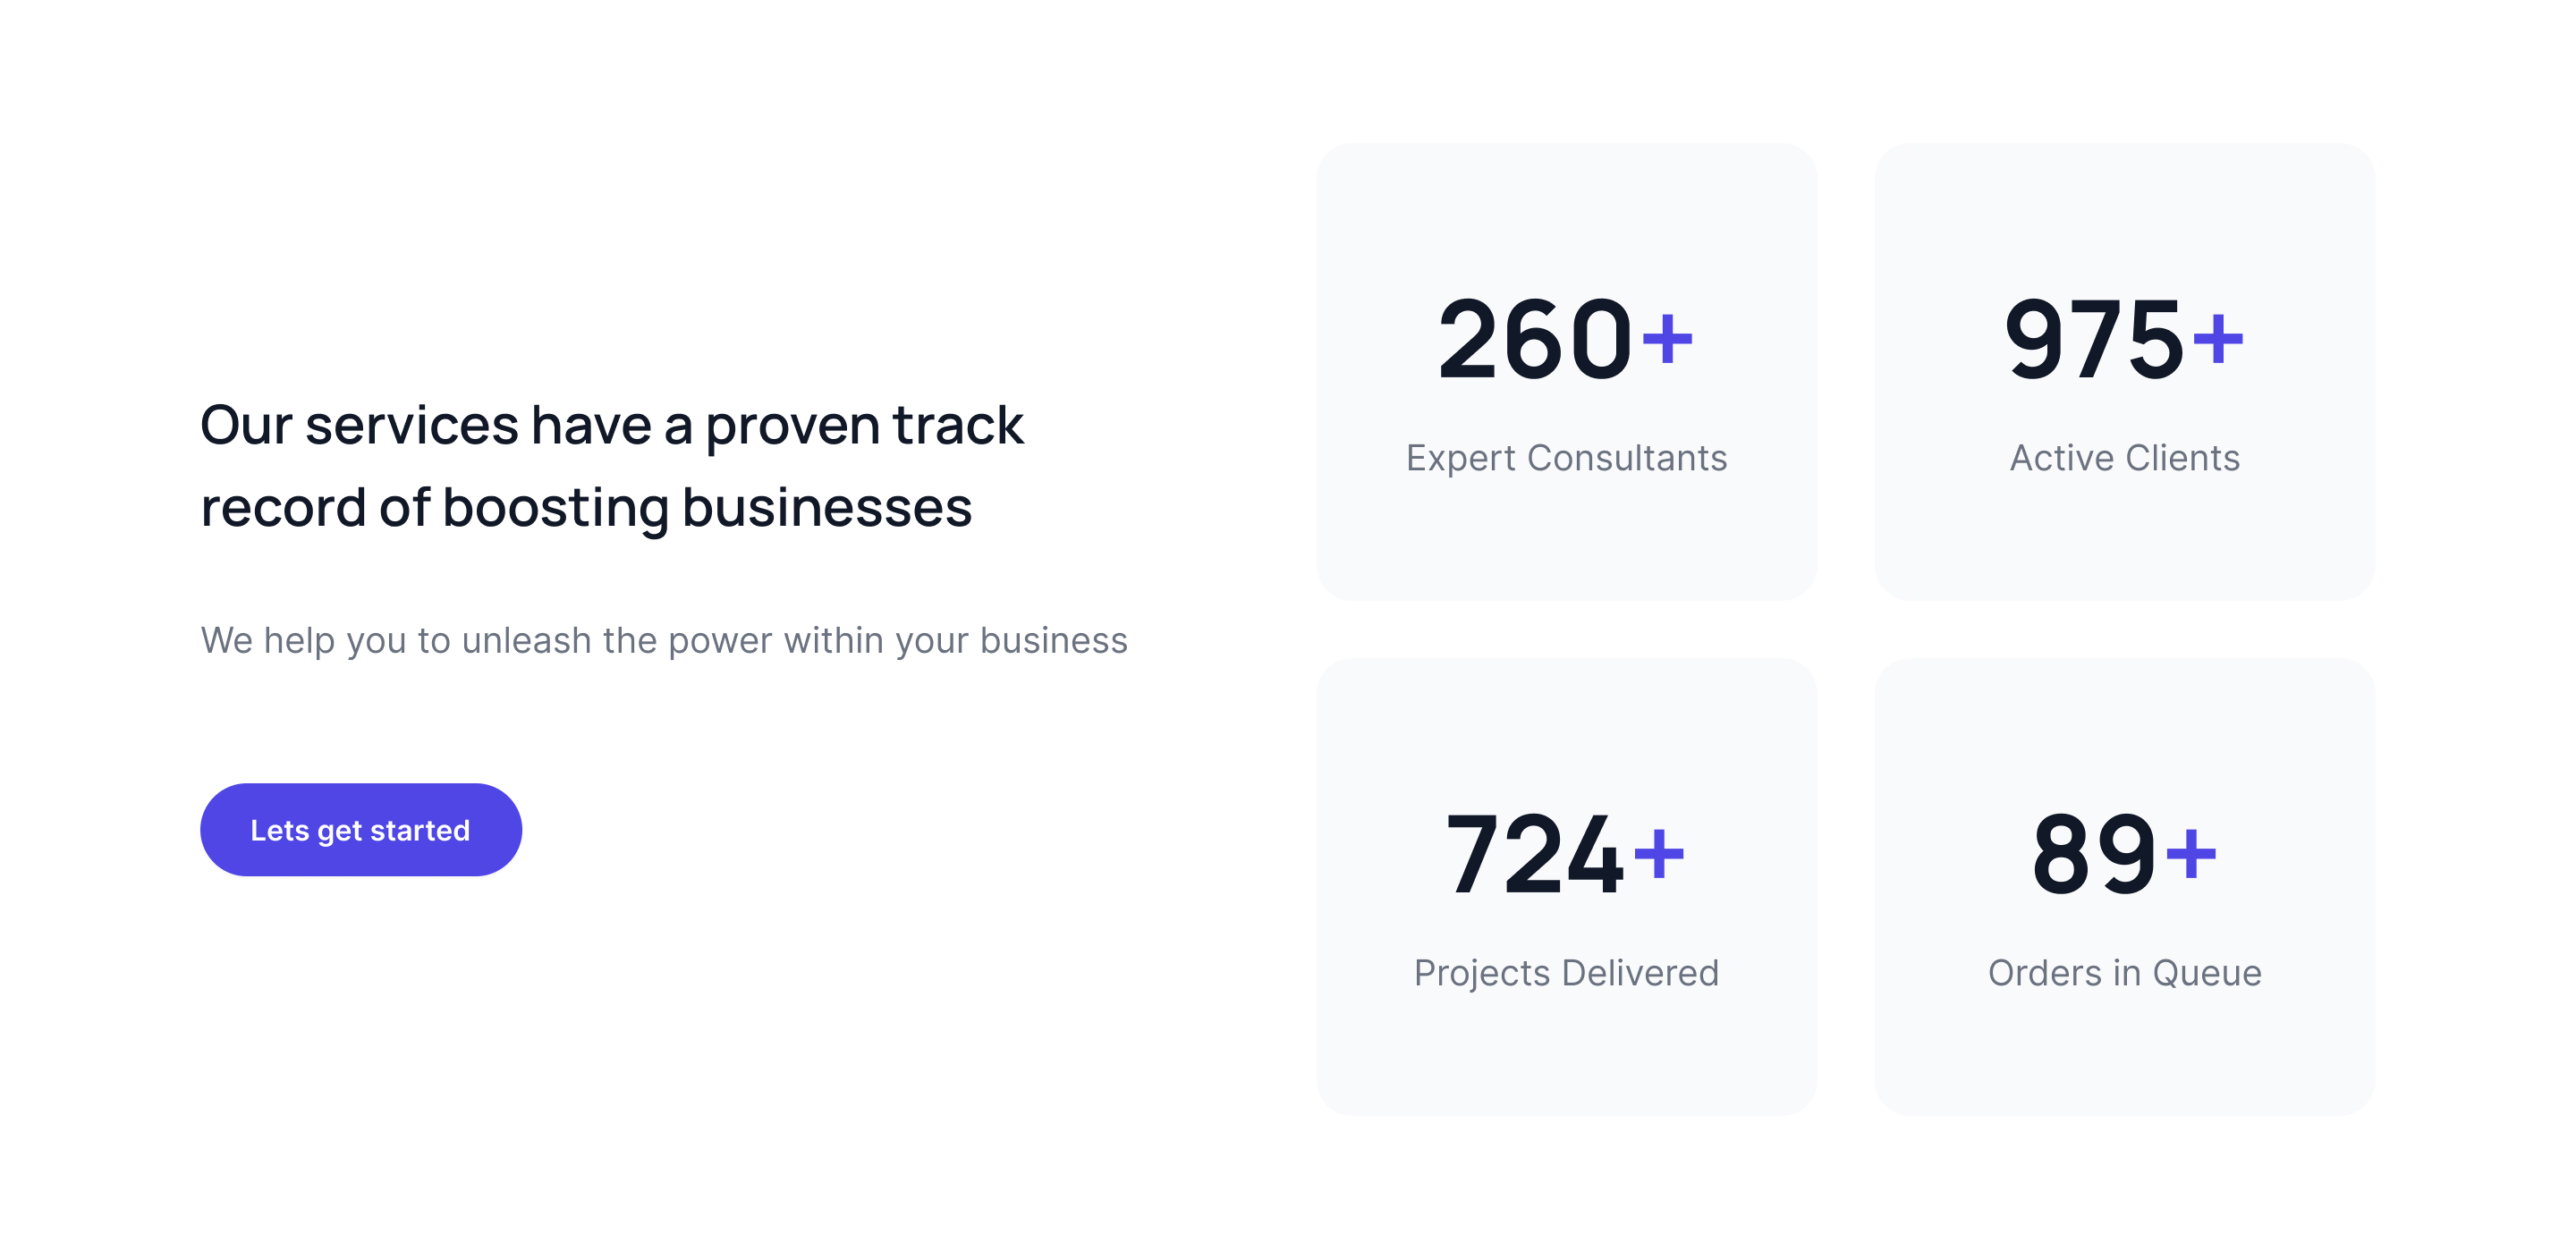
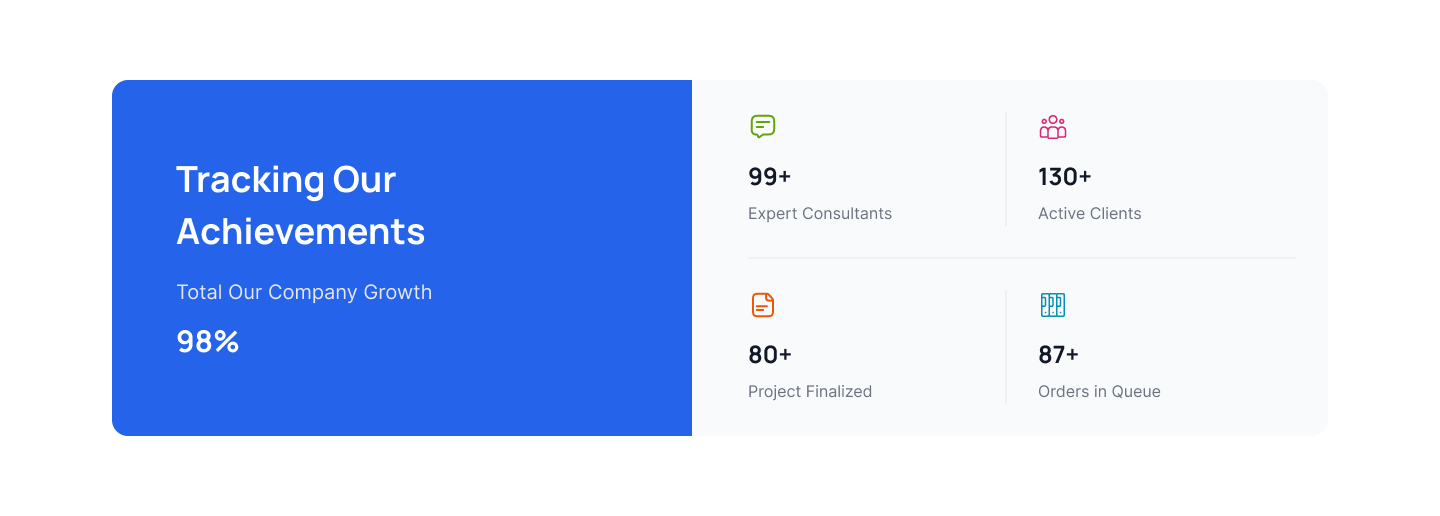
Split Stats with Heading
Showcase key achievements split with colored heading, bold overall stat, icon features, and brief descriptions.
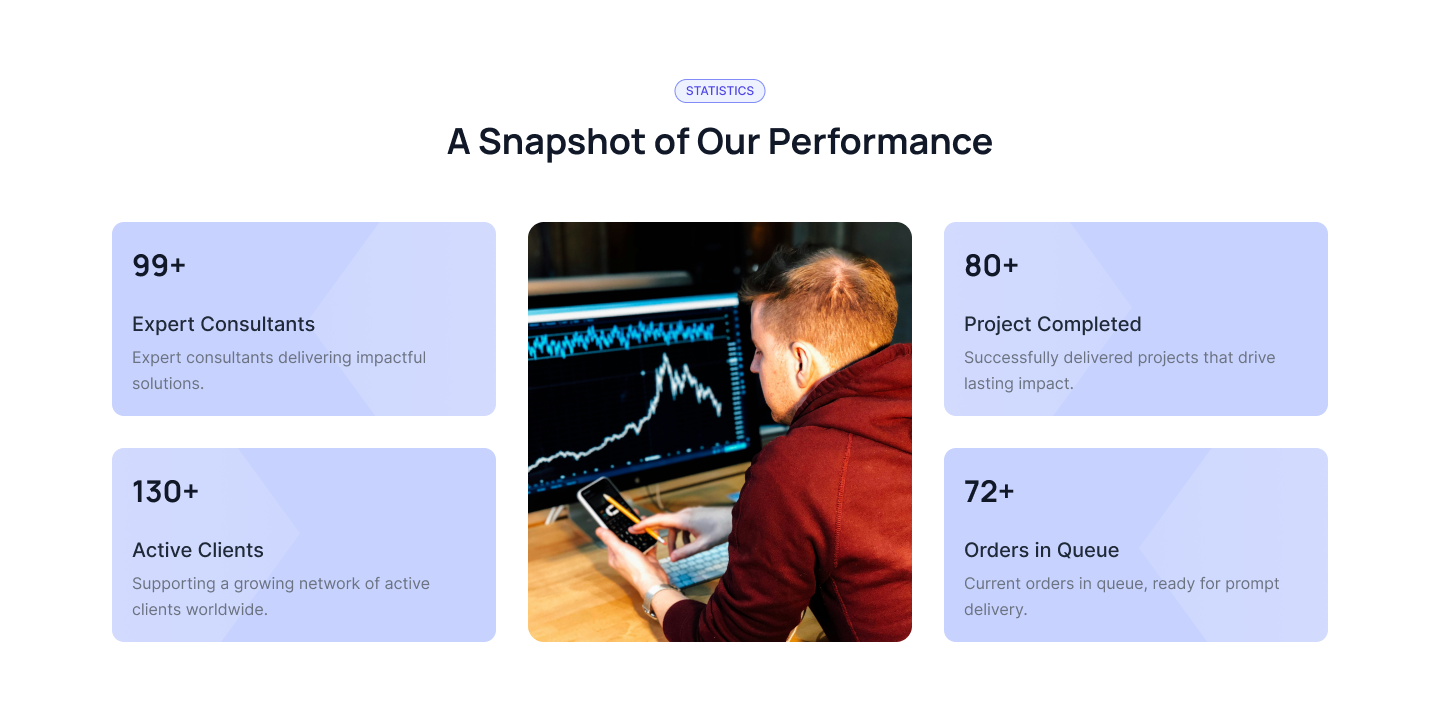
Tailwind CSS Stats with Performance
Show four key business stats around central image, colored cards, bold numbers, and brief supporting text.
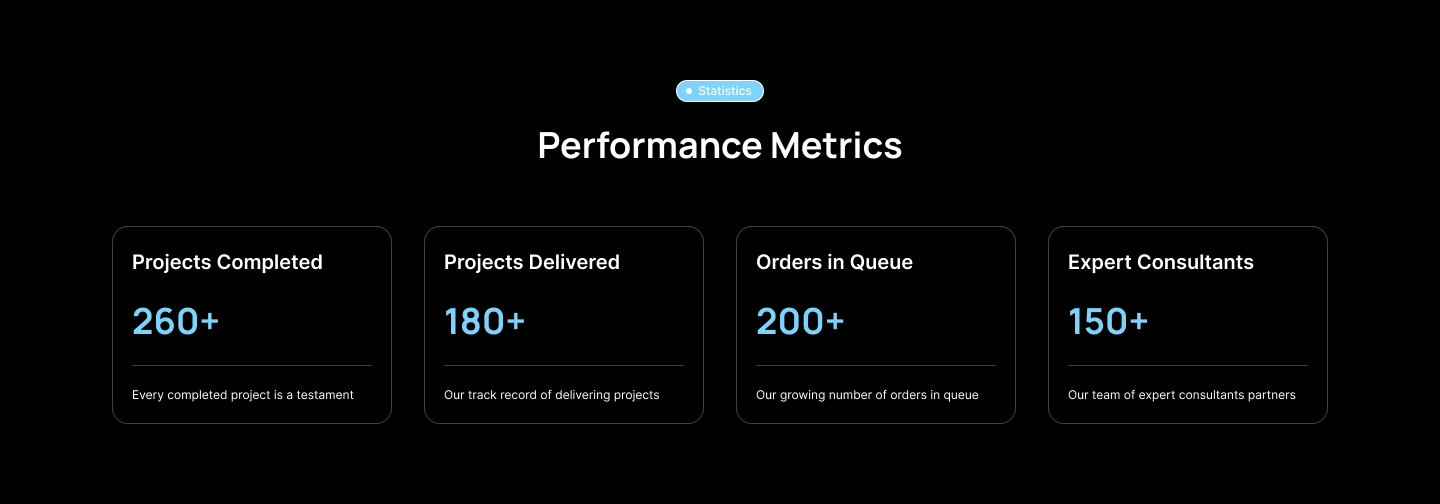
Performance Metrics Stats
Show four performance metrics in bordered cards, big blue numbers, category labels, and concise supporting text.
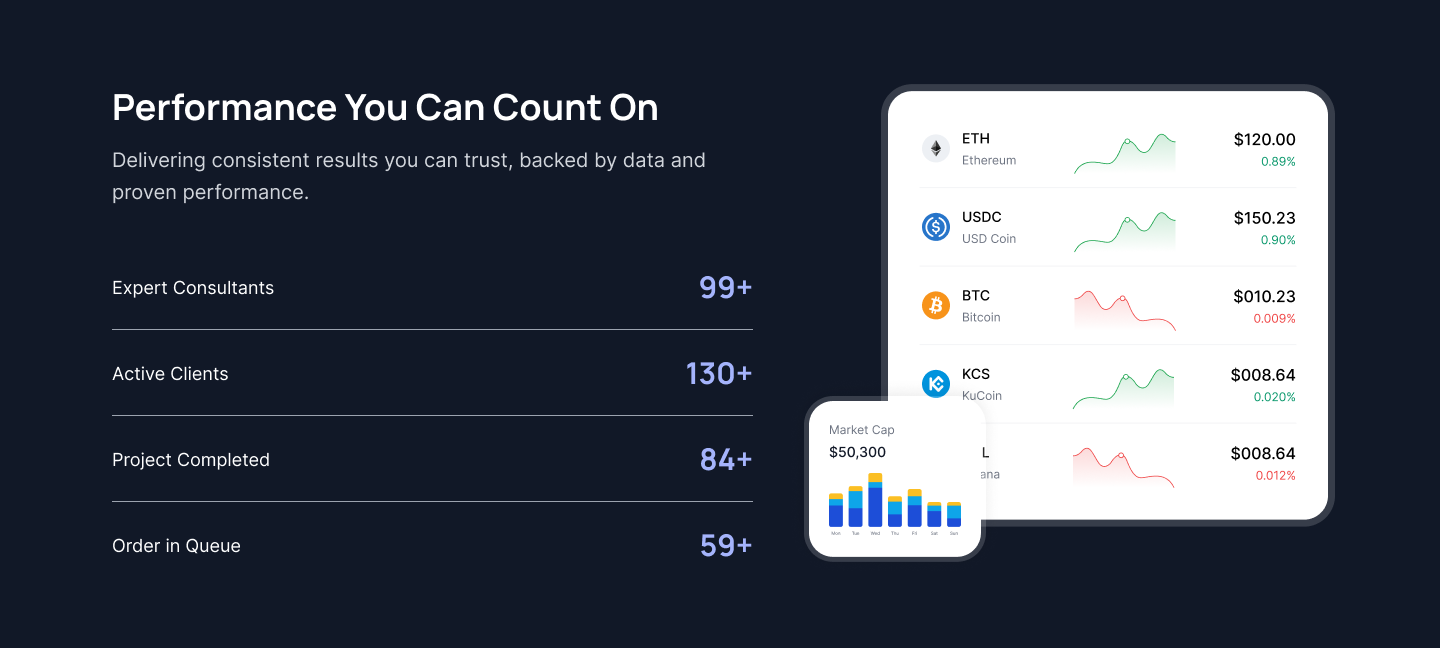
Performance You Can Count On
Showcase data-backed business metrics, impactful results, and expert achievements alongside a vibrant team visual.

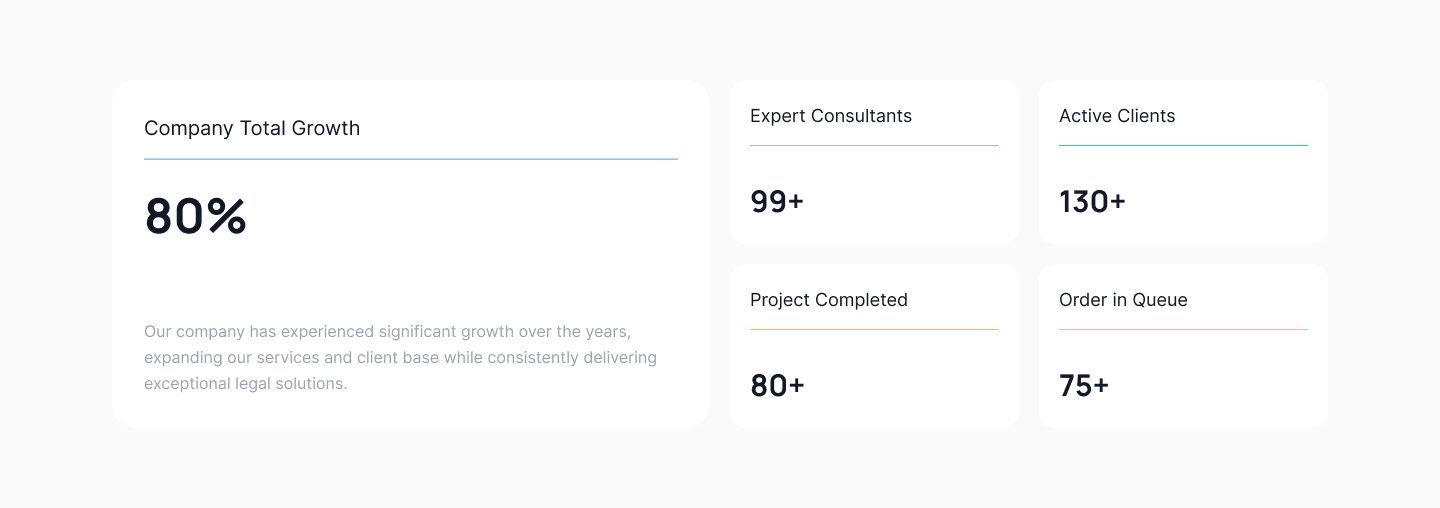
Company Total Growth Overview Stats
Show company growth progress, expert stats, and key project metrics in clean card layout with simple underlines.
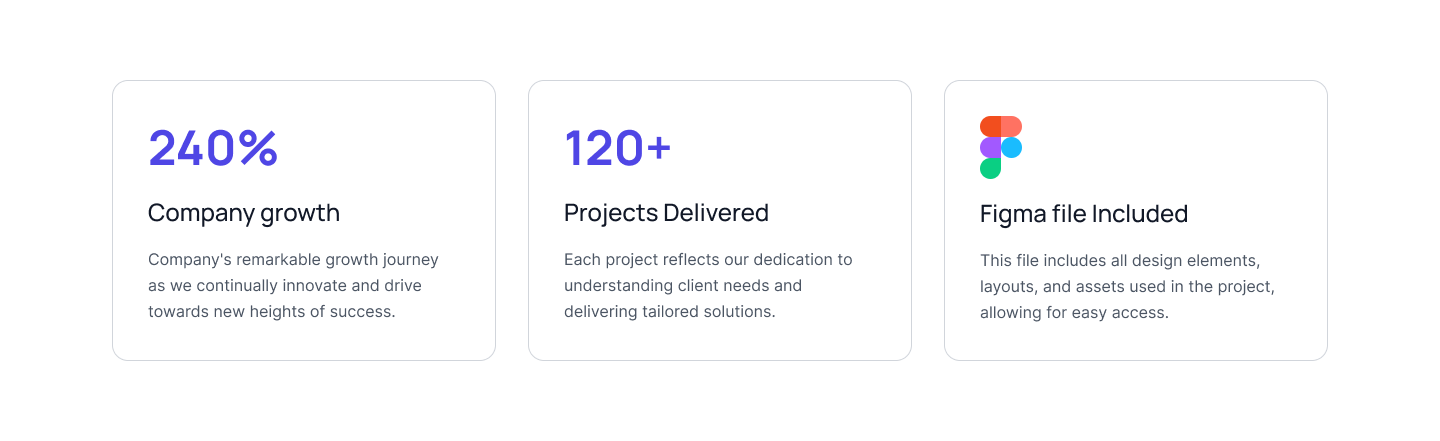
Project Stats and Figma Included
Showcase growth, delivered projects, and Figma file access in card layout with key stats and details.
Tailwind CSS Stats with Stats
Show key results and expert stats with supporting chart visuals for instant clarity and trust in business performance.
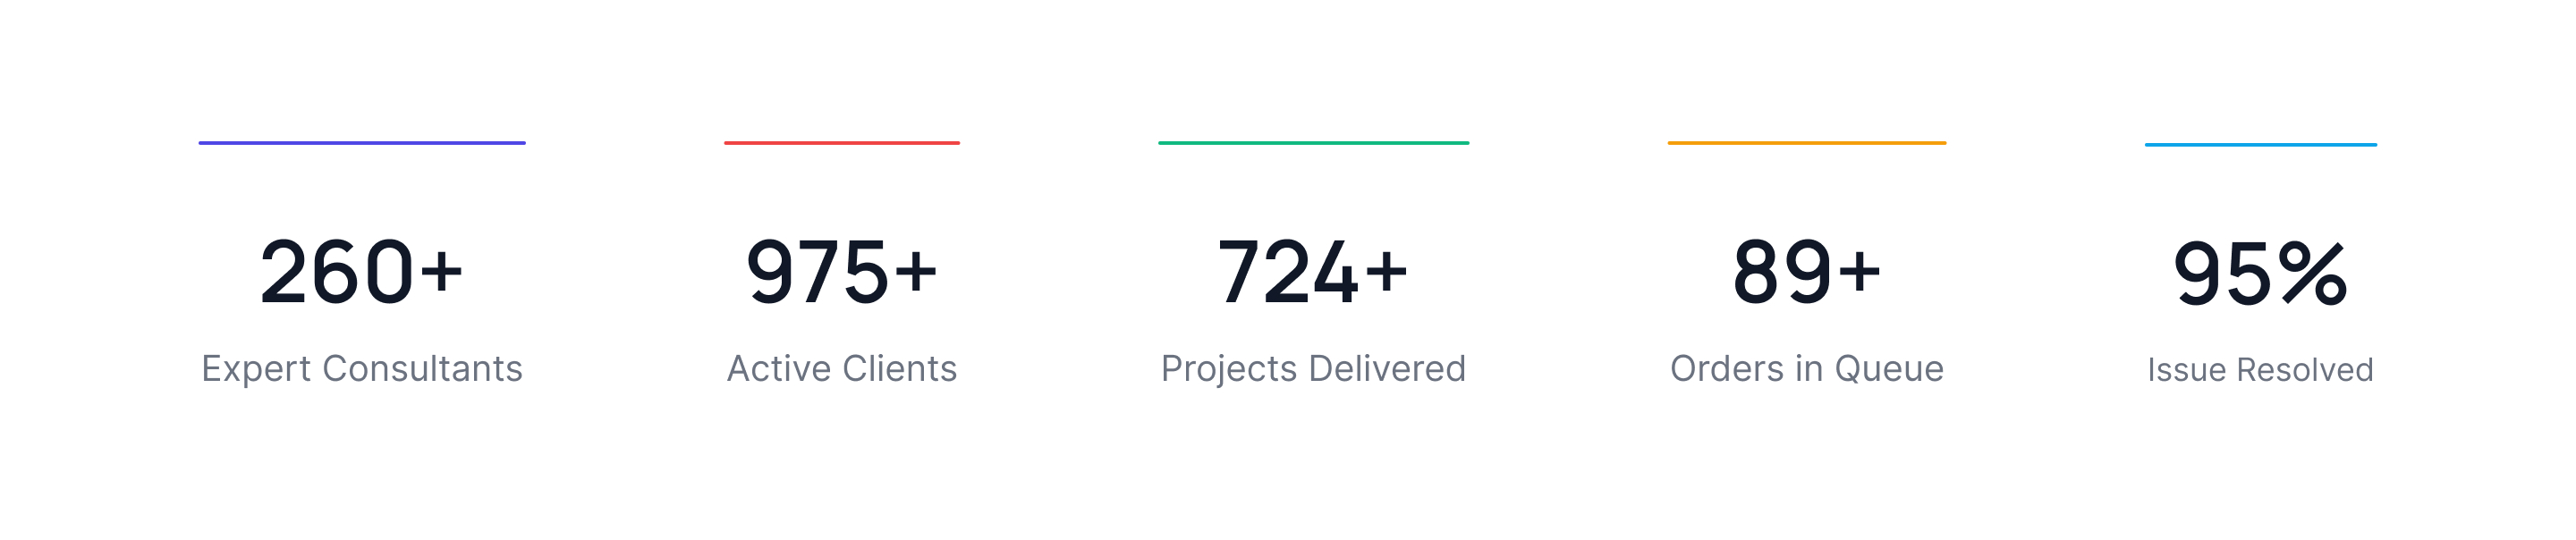
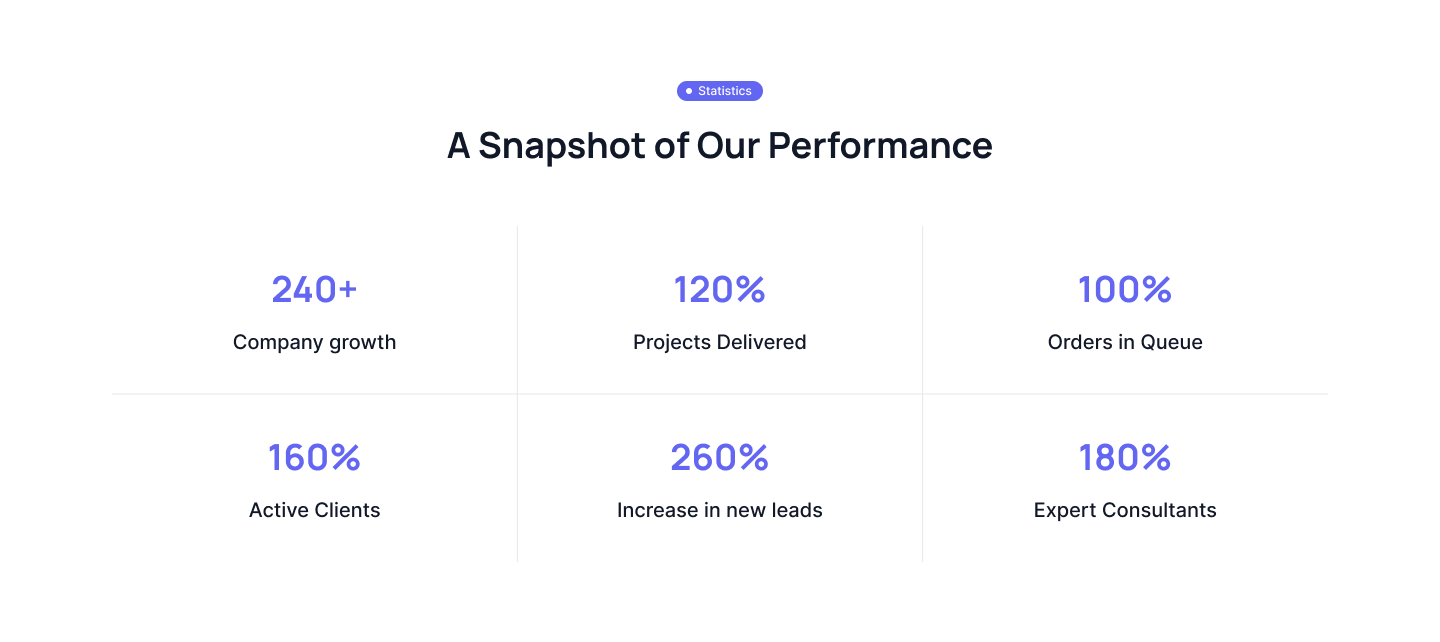
A Snapshot of Our Performance
Present six key business metrics in a two-row grid, bold numbers, and clear descriptive labels for instant insight.
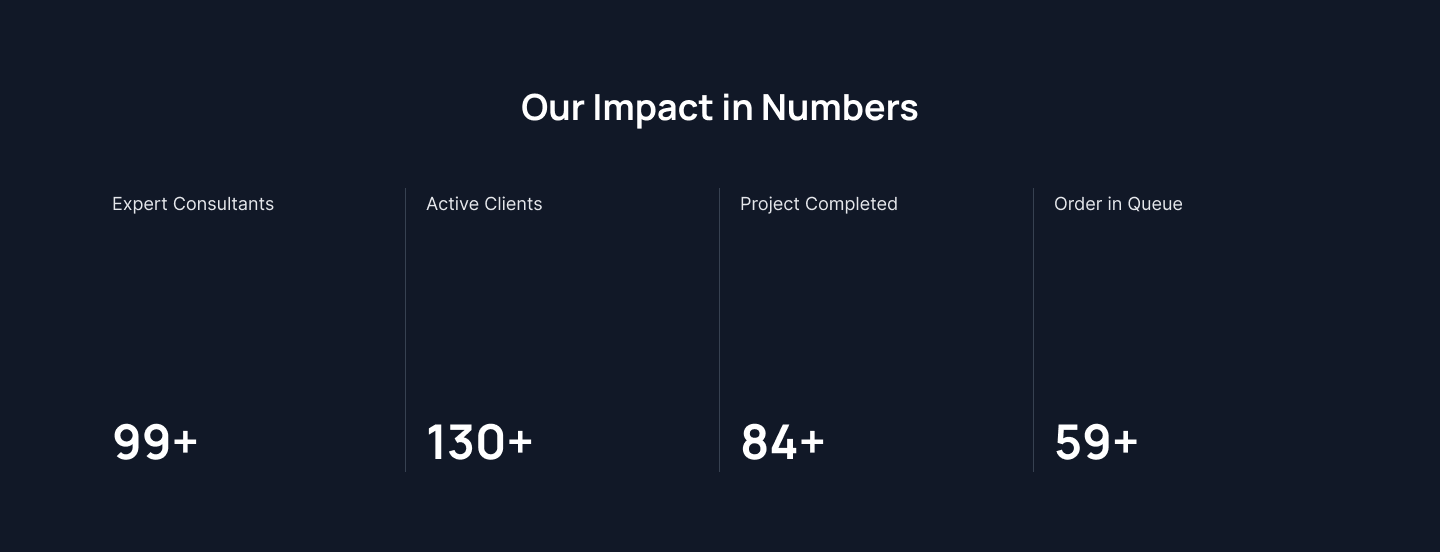
Our Impact in Numbers
Show key business stats in a four-column grid, with large numbers and clear labels for instant team performance insight.
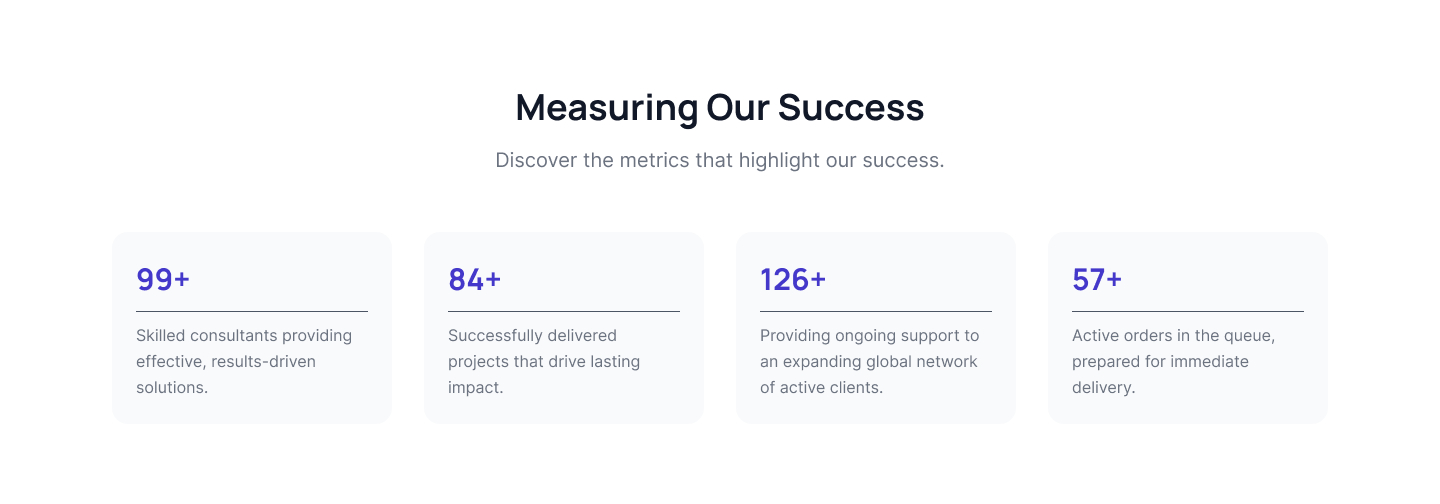
Measuring Our Success
Highlight four business metrics in cards, each with bold numbers, separators, and short actionable descriptions.
A Snapshot of Our Performance (Grid) Stats
Present six business metrics in a clean grid with bold numbers, concise titles, and subtle separators for clarity.
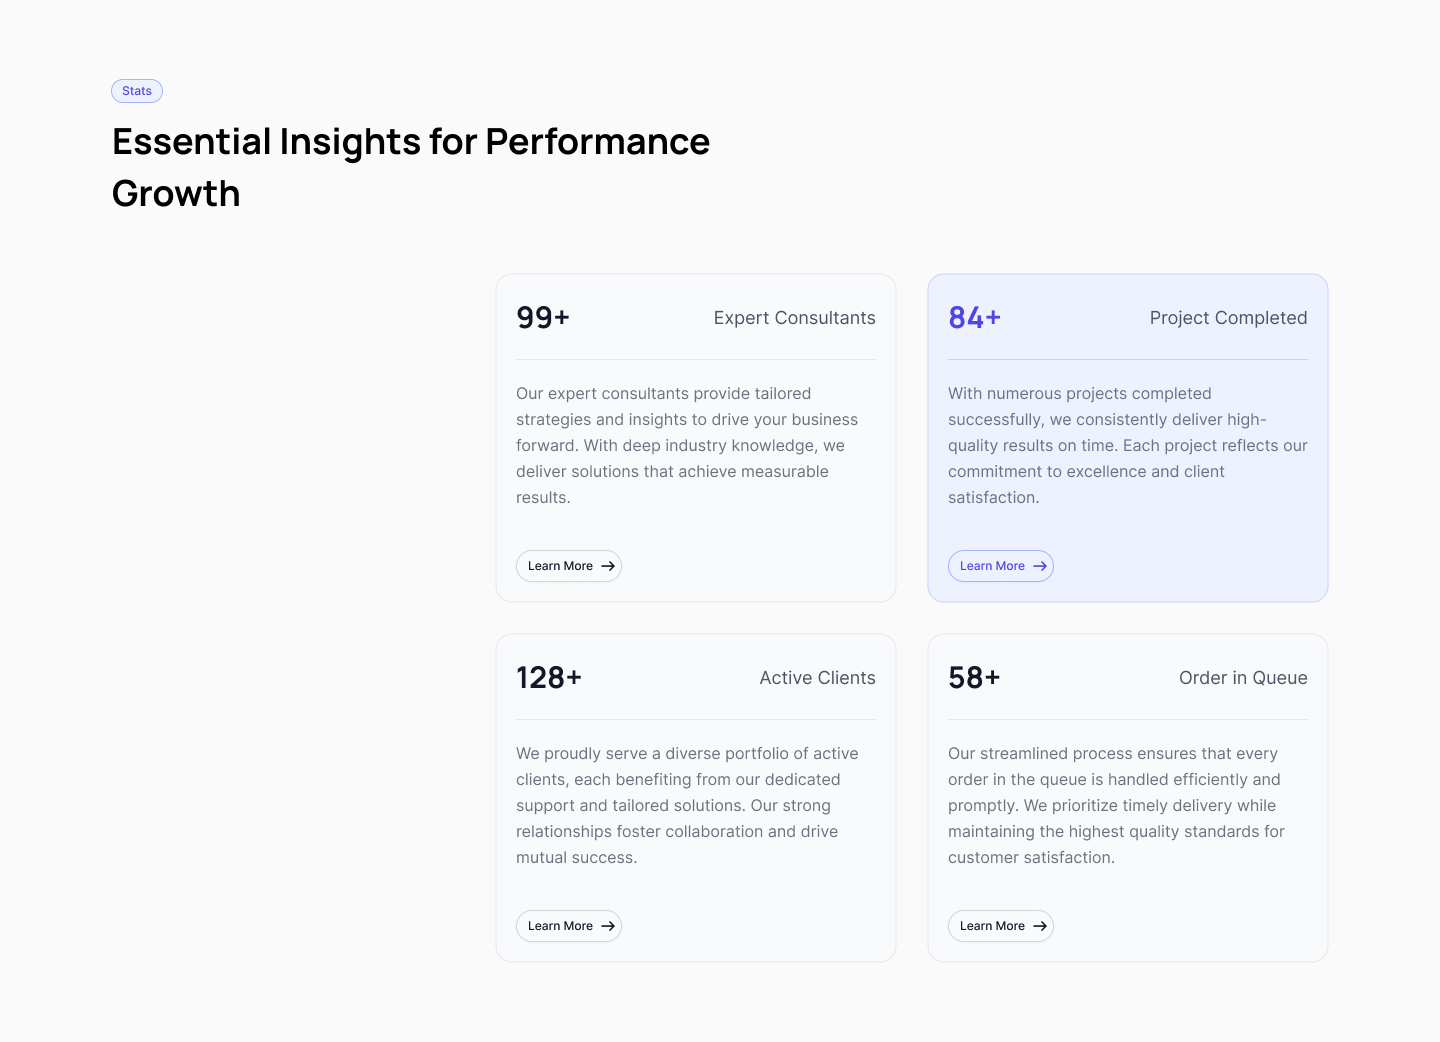
Key Metrics Driving Business Results
Showcase four business metrics in cards with actionable buttons and detailed descriptions for solution-driven impact.