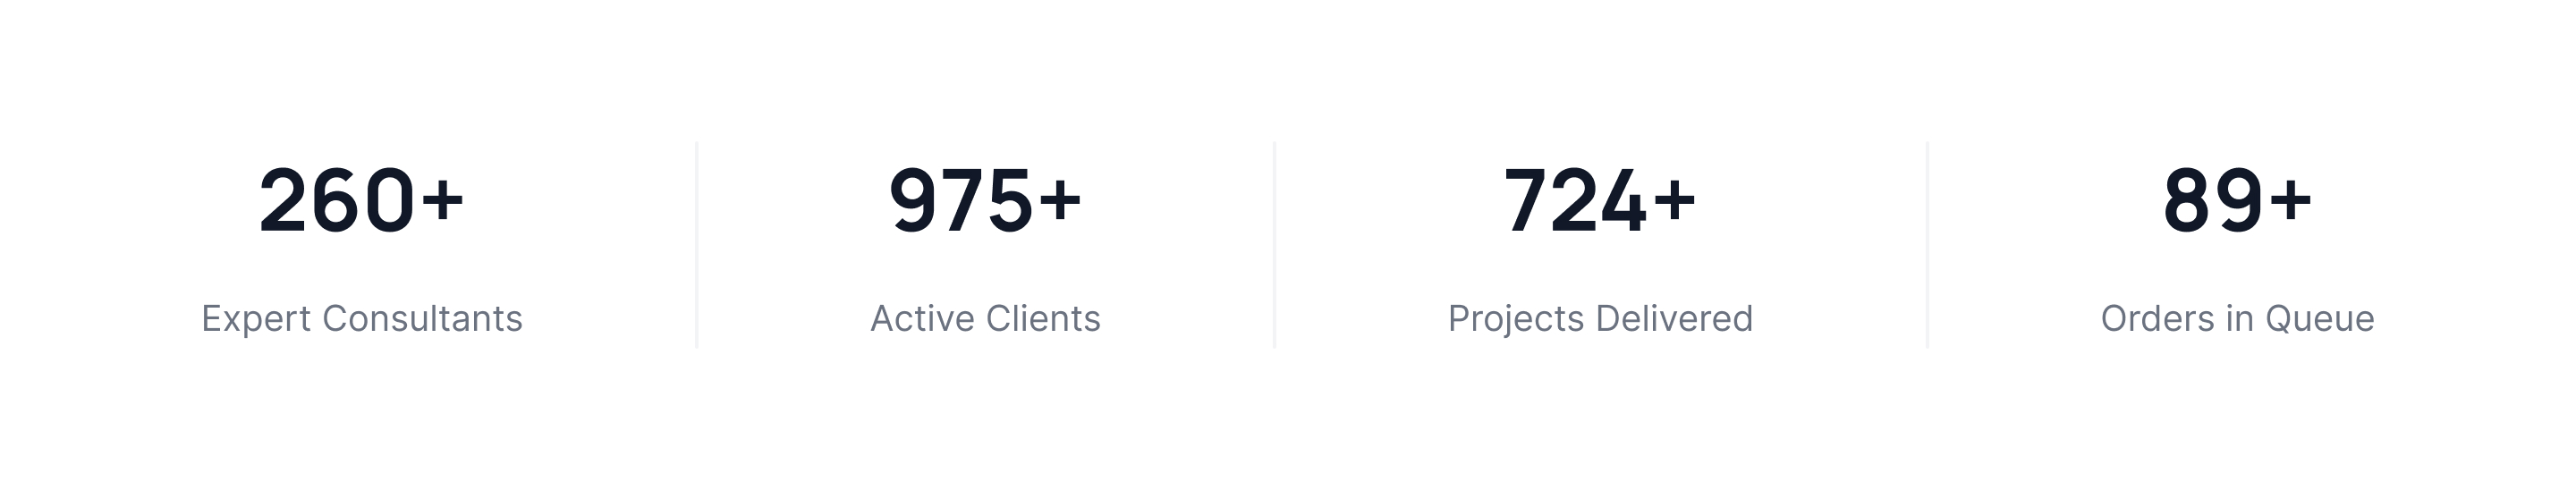
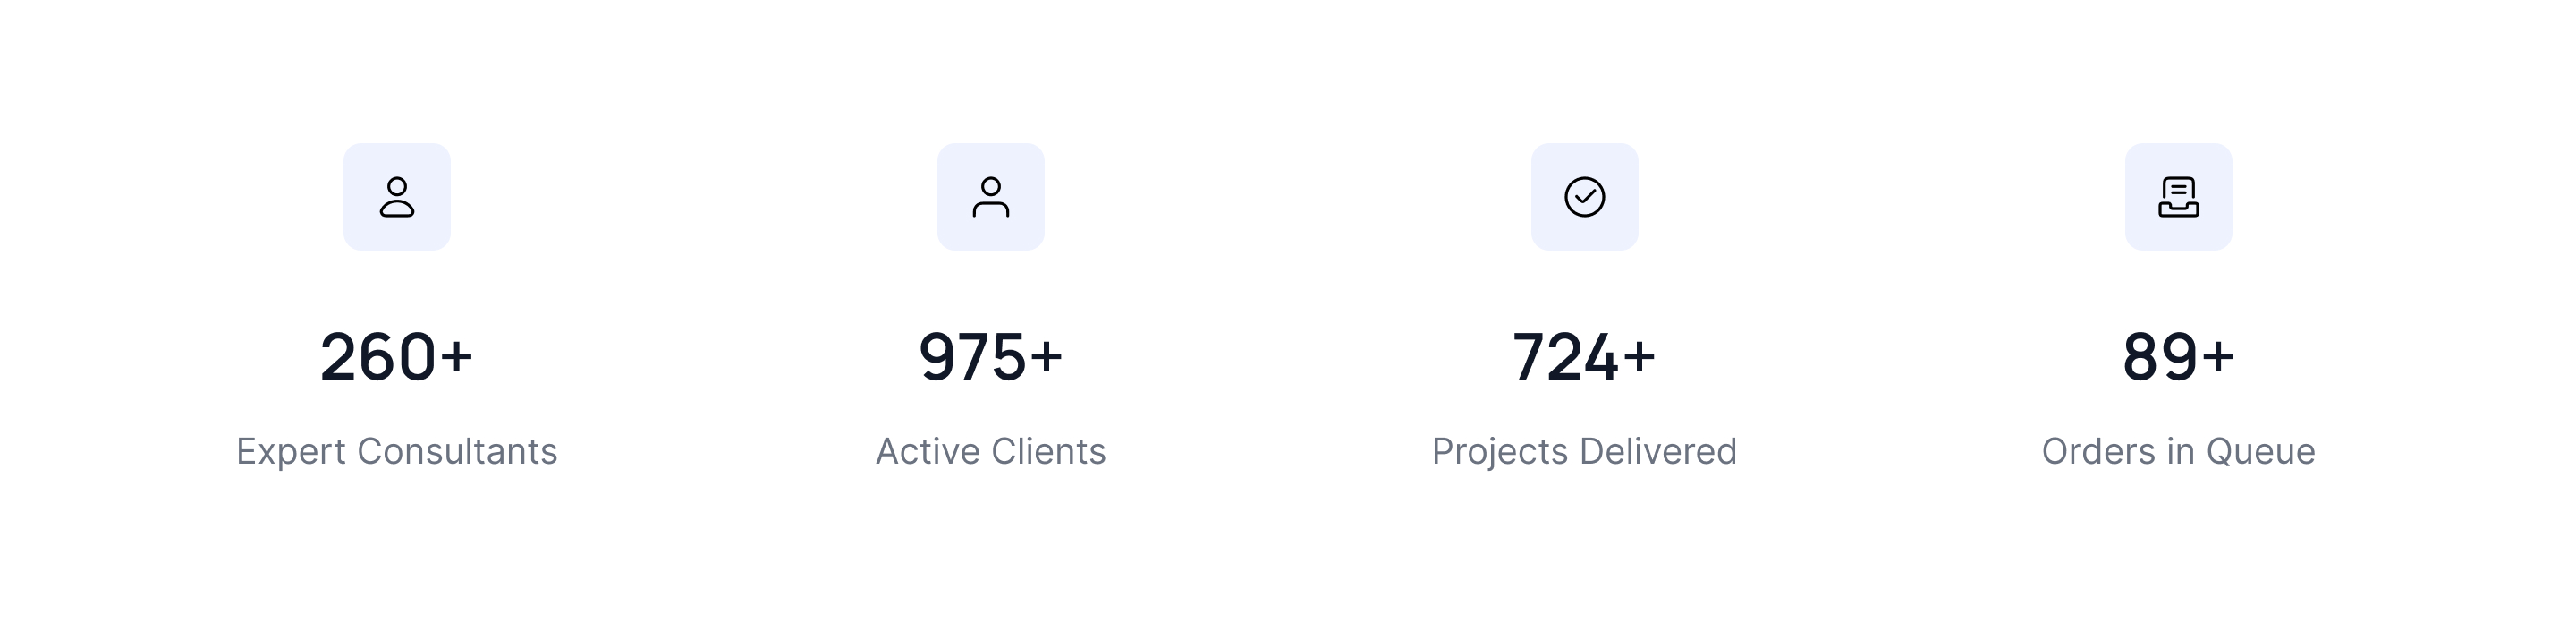
Display four simple stats, data and numbers with heading below.
                                        <section class="py-20">
        <div class="mx-auto max-w-7xl px-4 sm:px-6 lg:px-8">
          <div
            class="flex flex-col flex-1 gap-10 lg:gap-0 lg:flex-row lg:justify-between">
            <div class="w-full lg:w-1/4 border-b pb-10 lg:border-b-0 lg:pb-0 lg:border-r border-gray-100">
              <div
                class="font-manrope font-bold text-5xl text-gray-900 mb-5 text-center ">
                260+
              </div>
              <span class="text-xl text-gray-500 text-center block ">Expert Consultants
              </span>
            </div>
            <div class="w-full lg:w-1/4 border-b pb-10 lg:border-b-0 lg:pb-0 lg:border-r border-gray-100">
              <div
                class="font-manrope font-bold text-5xl text-gray-900 mb-5 text-center ">
                975+
              </div>
              <span class="text-xl text-gray-500 text-center block ">Active Clients
              </span>
            </div>
            <div class="w-full lg:w-1/4 border-b pb-10 lg:border-b-0 lg:pb-0 lg:border-r border-gray-100">
              <div
                class="font-manrope font-bold text-5xl text-gray-900 mb-5 text-center ">
                724+
              </div>
              <span class="text-xl text-gray-500 text-center block ">Projects Delivered
              </span>
            </div>
            <div class="w-full lg:w-1/4  ">
              <div
                class="font-manrope font-bold text-5xl text-gray-900 mb-5 text-center ">
                89+
              </div>
              <span class="text-xl text-gray-500 text-center block ">Orders in Queue
              </span>
            </div>
          </div>
        </div>
    </section>